
it is easy to get caught in analyzing a single table or database when that specific database has 1 percent of the rows, but it is not indexed enough, while the other table or database, which contains most of the data is there unserved
so, if we want to have a holistic overview, we need to look at 2 tools:
- performance counters
- and wait_stats
Performance counters
now, they would not show us exactly where to look, but they would tell us where the problem might be
now we stored some of them in this series before, now we are going to discuss how to use each one of them in cases
now we used the snapshots aka copies and history aka everything table method
so we are going with that
Case 1: forwarded records per second
a forwarded record is a record in a heap, that has been stored on a page
then at some point, that record is updated
now instead of allocating a new row_id SQL server elects to keep the record id in the same place,
and it stores the extra data on another page
and it keeps a stub or a forwarding stub at the original row_id
so now we have the row_id
updated data on another page
and a pointer or a forwarding stub that locates the updated data
why it would do such a thing?
because the updated row won’t fit on the same page
why not store it in a different row_id?
to avoid updating nonclustered indexes
for more details check out our blog
now for the impact of forwarding records on heaps, you can check this out here
now let’s create a heap that has some forwarding records:
create database testing
go
use testing
go
create table forwarding (
id int identity(1,1),
col1 varchar(6000)
)
create nonclustered index ix_idd on dbo.forwarding(id);
go
insert into dbo.forwarding(col1)
values (replicate('x',500))
go 1000
update dbo.forwarding
set col1 = replicate('x',3000)
where id % 3 = 1
go
so what we did here is to create a table that has col1 6000 kb even if it is null since it is char, not a varchar
then we update the values that have the remaining of 1 if divided by 3
so we have a forwarding record in each 3
we have a lot of pages there that only have a pointer to another page
now we are going to select* from it while we have PerfMon live monitor open
so in the start menu in windows type Performance monitor then select the live data window
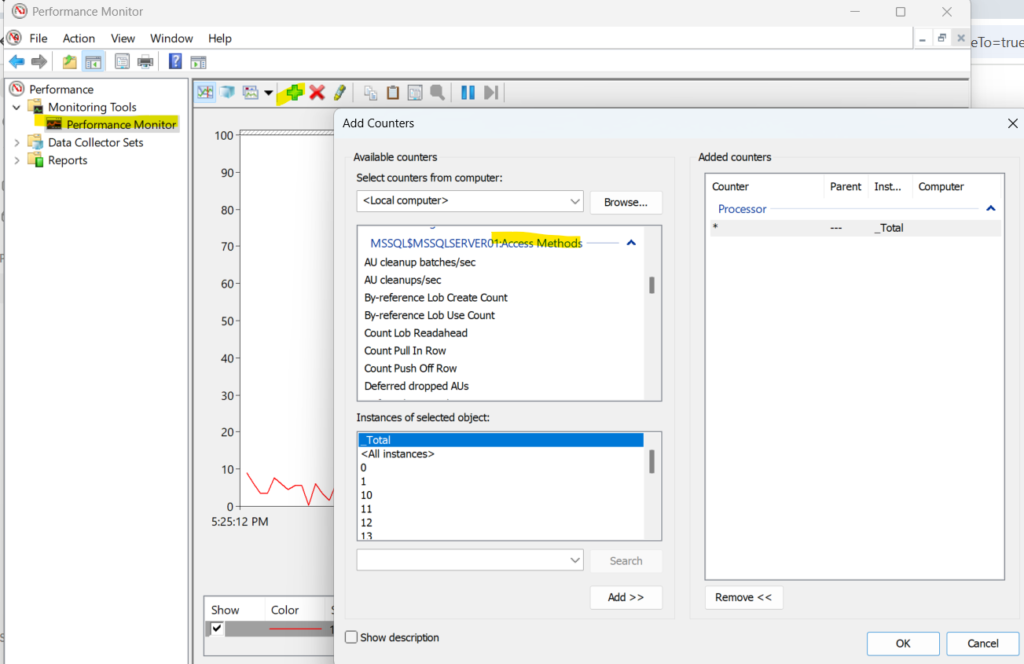
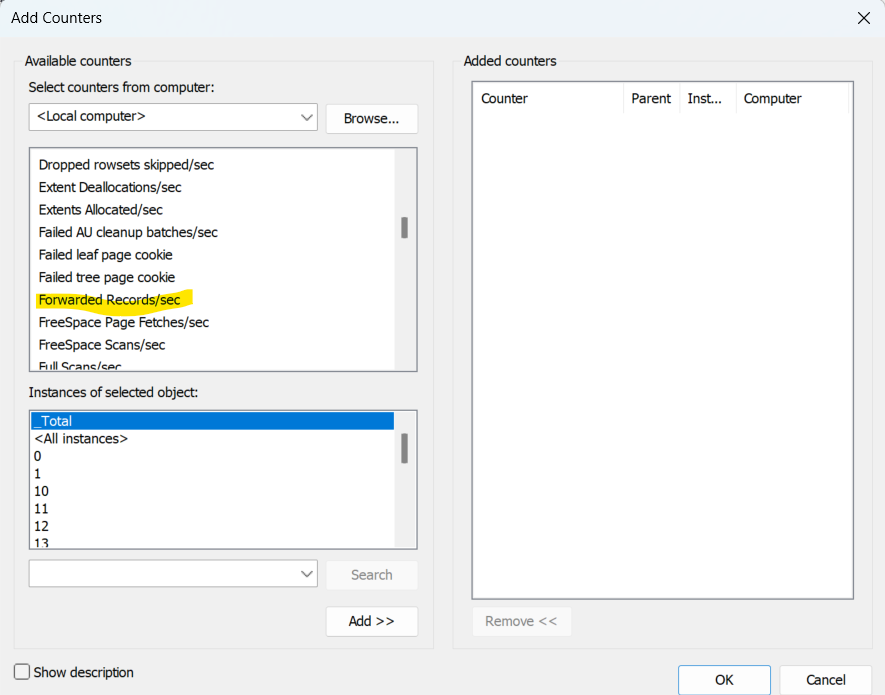
then select forwarded records:
now we are going to use SQL query stress to run this select statement
select*
from dbo.forwarding
we ran it 10 times in there and this is what we got
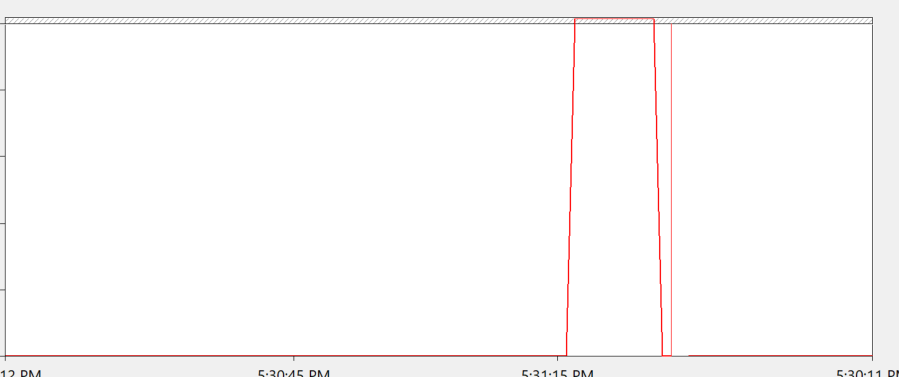
so this shows that the whole server is asking for a lot of forwarding records, but we don’t know which database to check
now this could be recorded in PerMon and read in Excel
or we could use the method we used before for snapshots and history
to do that check out our blog
now we could do what we did in there
take a snapshot now
and then run the select 100 times
and then take another snapshot
in our first snapshot, we don’t have any forwarded records
since we were not selecting at that particular moment
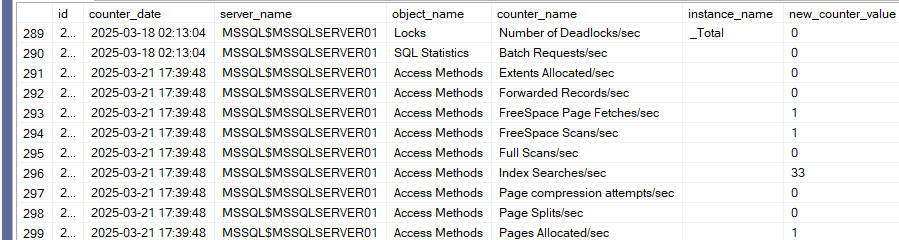
now we are going to run SQL query stress for 100 seconds and see what it records between that counter_date and this one
now the last time stamp was 2025-03-21 17:49:00
so we inserted between both
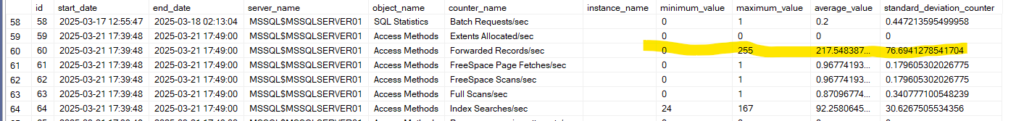
now as you can see here it detected the record change
now how could we know if this value is significant?
Forwarded records per second/ batch request per second
now this ratio should not exceed 10 percent
now one of them is at row level forwarded
and the other one works per requests on the server
but their division might be a good indicator
now how could we calculate that?
(we are basing this script on Jason Strate and Edward Pollack’s in indexing method here )
with forwarded_calculations as
(
select
counter_date,
server_name,
MAX(iif(counter_name = 'Forwarded Records/sec', new_counter_value,null)) as forwarded,
max(iif(counter_name ='Batch Requests/sec', new_counter_value,null)) as batch_request
from dbo.counters
where counter_name in ('Forwarded Records/sec','Batch Requests/sec')
group by counter_date, server_name
)
select
counter_date,
server_name,
forwarded,
(forwarded/nullif(batch_request*10,0)) as forwarded_ratio
from forwarded_calculations;
the output was like:
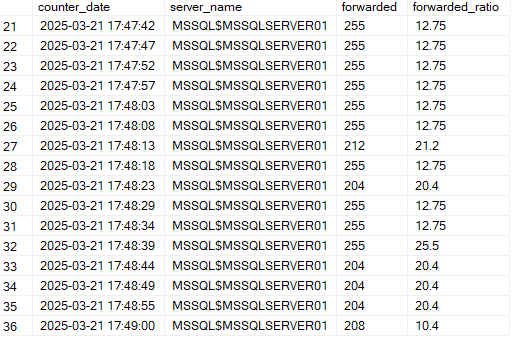
now there was a lot of output, but as you can see, since we ran the same test multiple times with the same values, we got similar output for each, except maybe at the end
so you see it
you look at the forwarded records alone, we might be mislead
but if we look at it with a ratio to the total batch requests, we can make an educated guess that some heap may be affecting the whole database
now if we keep looking individually, we can’t recognize trends
but if we query like the following:
with forwarded_calculations as
(
select
counter_date,
server_name,
MAX(iif(counter_name = 'Forwarded Records/sec', new_counter_value,null)) as forwarded,
max(iif(counter_name ='Batch Requests/sec', new_counter_value,null)) as batch_request
from dbo.counters
where counter_name in ('Forwarded Records/sec','Batch Requests/sec')
group by counter_date, server_name
)

select
server_name,
min(forwarded) as min_forwarded,
max(forwarded) as max_forwarded,
avg(forwarded) as avg_forwarded,
min((forwarded/nullif(batch_request*10,0))) as min_forwarded_ratio,
max((forwarded/nullif(batch_request*10,0))) as max_forwarded_ratio,
avg((forwarded/nullif(batch_request*10,0))) as avg_forwarded_ratio,
format
      (
      1.*sum
           (
             iif
                ((forwarded/nullif(batch_request*10,0))>1,
                 1,
                 null
                )

            )/count(*)
            ,'0.00%'
      ) as percent_violation
from forwarded_calculations
group by server_name
we got:

now for the max, avg, and min there is no issue
but for the last aggregation:
format
      (
      1.*sum
           (
             iif
                ((forwarded/nullif(batch_request*10,0))>1,
                 1,
                 null
                )

            )/count(*)
            ,'0.00%'
      ) as percent_violation
now first we get our calculation
then the iff function
if it exceeds 1 then we put 1
otherwise
the output is 1
now we are going to average percentage by dividing it by the count(*)
now to get the float division we multiply by 1.0 so SQL server does not have to round up
and then we format it using the format function as a percentage
and we get our desired output
which 77.78 percent
now this is too high since our workload consists of our demo
so we need to look into the heap thing
now if it was below 1 percent we don’t need to look at it
since it is too low to yield any benefit
unless we are looking to squeeze every bit of performance
but before that, we need to look at other issues
so that is it for performance counters
we can look at the minimum and maximum
are the average closer to the minimum or the maximum
if it is the maximum
then we need to look into it
now we could do the following:
use testing
go
if object_id('tempdb..#heaps') is not null
         drop table #heaps
create table #heaps
(
database_id int,
object_id int,
page_count iny ,
avg_page_space_used_in_percent decimal(6,3),
record_count int,
forwarded_record_count int
)
now until here not much, a temporary table based on the docs definition
use testing
go
if object_id('tempdb..#heaps') is not null
         drop table #heaps
create table #heaps
(
database_id int,
object_id int,
page_count iny ,
avg_page_space_used_in_percent decimal(6,3),
record_count int,
forwarded_record_count int
)
----
declare find_heaps_cursor forward_only for
select
from sys.indexes i
where index_id = 0
declare @index_id  int
open find_heaps_cursor
fetch next from find_heaps_cursor into @index_id
while @@fetch_status = 0
begin
    insert into #heaps
    select
    db_id(),
    object_id,
    page_count,
    avg_page_space_used_in_percent,
    record_count,
    forwarded_record_count
    from sys.dm_db_index_physical_stats(db_id(),@index_id,0,null,'detailed');
   fetch next from find_heaps_cursor into @index_id
 end
close find_heaps_cursor
deallocate find_heaps_cursor
---
now here we declare a cursor
that inserts the index_id variable into the parameter at physical stats DMF
while the database_id = db_id()
the fetch next forward only, makes it keeps going forward until the last row she finds where @@fetch_status = 0
and what are we inserting from the DMF, the stuff we defined in the temporary table
straightforward
use testing
go
if object_id('tempdb..#heaps') is not null
         drop table #heaps
create table #heaps
(
database_id int,
object_id int,
page_count int ,
avg_page_space_used_in_percent decimal(6,3),
record_count int,
forwarded_record_count int
)
----
declare find_heaps_cursor cursor forward_only FOR
select object_id
from sys.indexes i
where index_id = 0
declare @index_id  int
open find_heaps_cursor
fetch next from find_heaps_cursor into @index_id
while @@fetch_status = 0
begin
    insert into #heaps
    select
    db_id(),
    object_id,
    page_count,
    avg_page_space_used_in_percent,
    record_count,
    forwarded_record_count
    from sys.dm_db_index_physical_stats(db_id(),@index_id,0,null,'detailed');
   fetch next from find_heaps_cursor into @index_id
 end
close find_heaps_cursor
deallocate find_heaps_cursor
---
select
DB_NAME(database_id),
QUOTENAME(object_schema_name(OBJECT_ID)) + '.'+ QUOTENAME(object_name(object_id)) as [object_name],
page_count,
avg_page_space_used_in_percent,
record_count,
forwarded_record_count,
s.forwarded_fetch_count,
convert(decimal(7,3),100.*forwarded_record_count/record_count) as forwarded_ratio,
convert(decimal(13,3),1.*s.forwarded_fetch_count/forwarded_record_count) as forwarded_row
from #heaps hs
       cross apply (
                     select sum(e.forwarded_fetch_count) as forwarded_fetch_count
                     from index_dmo.dbo.index_operational_stats_everything e
                     where e.database_id = hs.database_id
                       and e.object_id = hs.object_id
                       and e.index_id = 0) s
where forwarded_record_count> 0
order by page_count desc
now here, what we did after we got the temporary table that contains the physical stats we want
the newly updated heap that has a lot of forwarded records from the cursor
we are measuring how often it is being used
by our stored data
that we scripted from operational stats( for more check out this)
now we are only getting heaps
and we are calculating two ratios
one for how many records do you have as forwarded in general compared to the regular old fashion records
and how many times did we fetch it, you know fetch the row
ordered them by pages, since if the table is too small to be considered there is no need to fix it
the output was like:

so we see the database in quotes because of the quotename,
we see the percentage of forwarded in our forwarded_ratio of records that are forwarded 20 percent is high,
now of those 20 percent, each one has been accessed 309 times
that is a lot
and the pages are not much but since we are testing we are going to pay attention to this specific table
now it is using most of its space since most of the table is not forwarded
we see everything we requested, the next step is to take action
now what could we do?
change it to a non-variable column so we don’t have to deal with increase in space in page and then forward
The downside, takes more space, and the character field has a limit so It might some query errors
Create a clustered index. okay but which key should we pick
Rebuild the heap?
this is the worst since forwarded records will come back as soon as new update statements start to kick in
or the other options we talked about in here
and we that we finish our first performance counter analysis, see you in the next blog
[…] So, what we could do is use the methodology described in our PerfMon counters blogs […]