
now today we are going to introduce performance counters that are used to give us an overview of instance-level index usage, so we can know if a specific problem should be handled or not
Here we will use the DMV inside SQL server that references the tool
now these are inspired by Jason Strate and Edward Pollack
They have the indexing method here
Intro
now if we select like this from sys.dm_os_performance_counters:
select*
from sys.dm_os_performance_counters
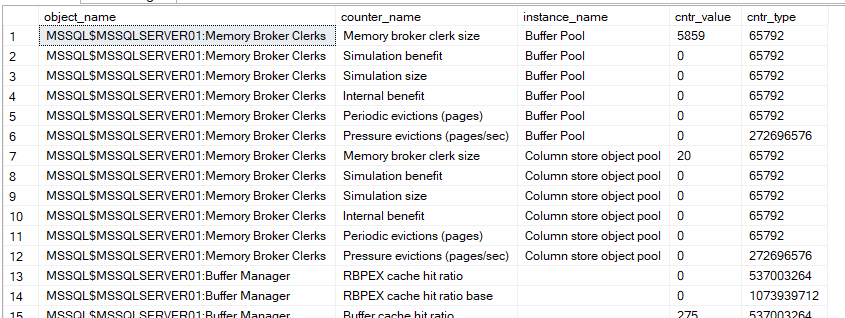
as you can see it shows us:
- object_name: here it shows us which PerfMon category this event belongs to so if we click on live data session in performance monitors we can find categories like:
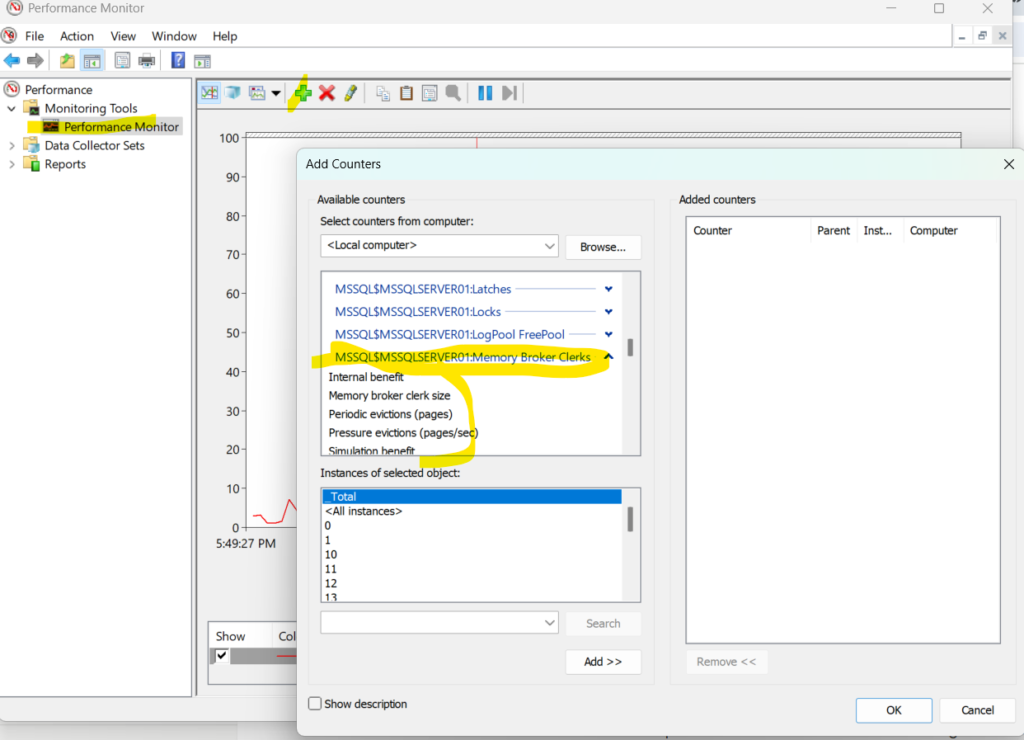
as you can see this blue this is the object_name which is the category that this event belongs to
- counter_name: the name of it like internal benefit
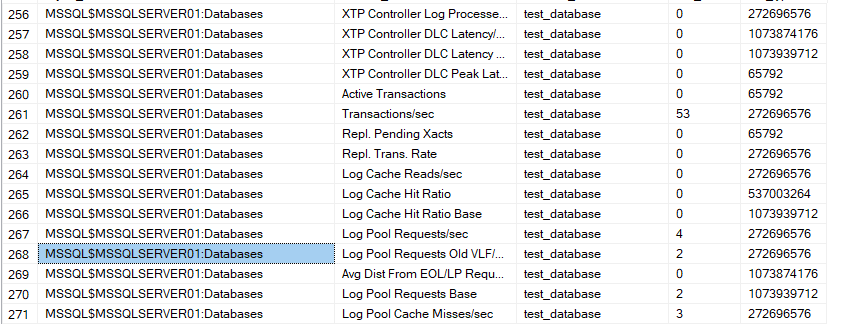
- instance_name: where is this specific event is being recorded it could be on a page or a database like
- cntr_value: how many times did this specific counter happen, now this is cumulative so in order to analyze the information, we have to have a baseline, and two separate dates, then exclude the baseline and the start from the end and we would get the needed value
- cntr_type: something internal to Windows, not SQL server, we care about how it is calculated
now as you can see here, we need to persist in a baseline to compare to in order to evaluate
so to do that we need a database
Creating a database to store it
let’s call it Perf_Mon:
create database Perf_Mon
go
use Perf_Mon
go
dbo.counters the storing table
Now we are going to create a table to persist the information from this:
create table dbo.counters(
id int identity(1,1),
counter_date datetime2(0),
server_name varchar(128) not null,
object_name varchar(128) not null,
counter_name varchar(128) not null,
instance_name varchar(128) null,
new_counter_value float null,
constraint PK_CI_counters_id
primary key clustered(id)
);
now here as you can see we looked at the docs and added some columns
like the clustered
and the server_name
and since it was a table valued function in the execution plan, we could not see the clustered index
but we are going to use this too much so adding one would help performance
and since we are going to use most of these columns we are going to add a covering nonclustered:
create nonclustered index ix_counters_counter_name on
dbo.counters(counter_name)
include(counter_date,server_name,object_name,new_counter_value);
now the counter value is not the same as cntr_value
we are going to do some calculations
so what are we going to do? insert each counter name through a temporary table
go
use perf_mon
go
drop table if exists #counters;
select pm.object_name,
       pm.counter_name
into #counters
from sys.dm_os_performance_counters as pm
where pm.cntr_type in(272696576,1073874176)
and (pm.object_name like '%:Access Methods%'
      and (
           pm.counter_name like 'Forwarded Records/sec%'
           or pm.counter_name like 'FreeSpace Scans/sec%'
           or pm.counter_name like 'FreeSpace Page Fetches/sec%'
           or pm.counter_name like 'Full Scans/sec%'
           or pm.counter_name like 'Index Searches/sec%'
           or pm.counter_name like 'Page Splits/sec%'
           or pm.counter_name like 'Pages Allocated/sec %'
           or pm.counter_name like 'Extents Allocated/sec%'
           or pm.counter_name like 'Page compression attempts/sec%'
           or pm.counter_name like 'Pages compressed/sec%'
           )
     )
or  (pm.object_name like'%:Buffer Manager%'
      and (pm.counter_name like'Page life expectancy%'
            or pm.counter_name like'Page lookups/sec%'
           )
    )
or (pm.object_name like '%:Locks%'
     and(pm.counter_name like 'Lock Wait Time (ms)%'
         or pm.counter_name like 'lock waits/sec%'
         or pm.counter_name like 'Number of Deadlocks/sec%'
         )
    )
or (pm.object_name like '%:SQL Statistics%'
    and pm.counter_name like 'Batch Requests/sec%'
    )
group by pm.object_name,pm.counter_name;
now here we simply inserted the names of the counters and which server, object they are monitoring and what type of counter they are
we went for example here :
select pm.object_name,
       pm.counter_name
into #counterss
from sys.dm_os_performance_counters as pm
where pm.cntr_type in(272696576,1073874176)
and (pm.object_name like '%:Locks%'
     and(pm.counter_name like 'Lock Wait Time (ms)%'
         or pm.counter_name like 'lock waits/sec%'
         or pm.counter_name like 'Number of Deadlocks/sec%'
         )
    )

group by pm.object_name,pm.counter_name;
here we inserted into temp table counterss
from our counters
where their type = internal type number = something related to the whole windows not just SQL server
the counters related to every server
that has :locks at the end of its object_name or the server’s, instance’s name
where the counter’s name os ‘lock waits/sec%’
we grouped them by their server then the counter name
now if we select from our #counter:
go
select*
from #counters
and the output was like:
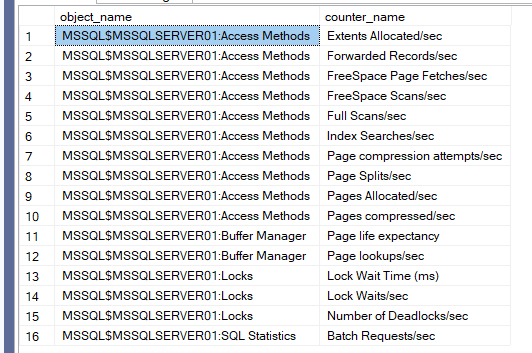
now we can add, and modify the counters for other purposes but for now, this is sufficient.
so we took the names
now for counter types, ours were:
- 272696576 now this PERF_COUNTER_BULK_COUNT(docs) this means that this one counts some event that is happening per second like index searches per second
- 1073874176 now this one counts the operations processed on the operations completed and it requires a base value to output itself now here Average Wait Time (ms) could be since it calculates how many process have to wait while some other thing is being completed
the main thing here is the difference in calculations
cntr_value for both is different, which means we have to apply different logics for both to get the actual value we want
now here only extents allocated is the one that falls off to the second category, so only that one needs a base
now let’s do that:
go
drop table if exists #normal_hours;
select GETDATE() as recording_time,
       pm1.object_name,
       pm1.counter_name,
       pm1.instance_name,
       pm1.cntr_value,
       pm1.cntr_type,
       pro_s.cntr_value as needs_base
into #normal_hours
from sys.dm_os_performance_counters pm1
inner join #counters c on c.object_name = pm1.object_name
                       and c.counter_name =pm1.counter_name
outer apply(
            select cntr_value
            from sys.dm_os_performance_counters pm2
            where pm2.cntr_type =1073874176
            and LOWER(pm1.counter_name) = LOWER(pm2.counter_name)
            and pm1.object_name = pm2.object_name
            and pm1.instance_name = pm2.instance_name
            ) pro_s
;
waitfor delay '00:00:05';
now here what we did is just getting the rows that we wanted from the performance counters, so just what we want keep, which we recorded in the previous temp table #counters
so we joined it with the sys.dm_db_performance_counters again
and we want to calculate the value for the counters that needs a base or the second type
so we outer applied it to another subquery where it only got the values from the counters that matches the results that we want, kind of like applying into a DMF, except here we defined it by the counters that need base
value
now if we select*:
select*
from #normal_hours
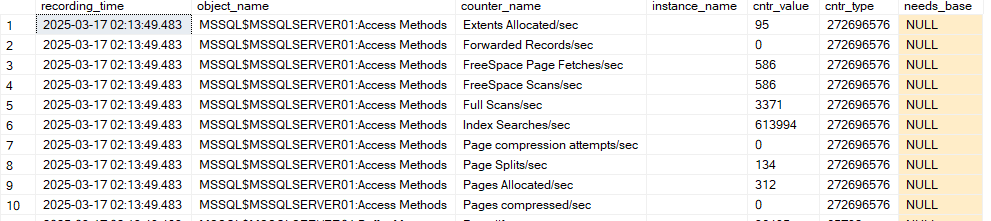
so none of these had this value in them since all of them were from another type
inserting the filtered counters
now after that we should insert into our original table dbo.counters:
go
insert into dbo.counters(
counter_date,
server_name,
object_name,
counter_name,
instance_name,
new_counter_value
)
select
GETDATE() now_date,
left(pm1.object_name,CHARINDEX(':',pm1.object_name)-1),
SUBSTRING(pm1.object_name,1 + CHARINDEX(':',pm1.object_name),LEN(pm1.object_name)),
pm1.counter_name,
pm1.instance_name,
case
    when pm1.cntr_type = 65792 then pm1.cntr_value
    when pm1.cntr_type = 272696576 then
         coalesce((1*pm1.cntr_value - n.cntr_value)/nullif(datediff(s,recording_time,getdate()),0),0)
    when pm1.cntr_type = 537003264 then coalesce((1.* pm1.cntr_value)/nullif(base.cntr_value,0),0)
    when pm1.cntr_type = 1073939712 then coalesce((1.*pm1.cntr_value-n.cntr_value)/nullif(base.cntr_value-n.needs_base,0)
                                                                                 /nullif(datediff(s,recording_time,getdate()),0),0)
                                                                                  end as the_value
from sys.dm_os_performance_counters pm1
     inner join #counters c on c.object_name = pm1.object_name
            and c.counter_name = pm1.counter_name
outer apply(
             select cntr_value,
                    needs_base,
                    recording_time
             from #normal_hours n
              where n.object_name = pm1.object_name
                    and n.counter_name = pm1.counter_name
                    and n.instance_name = pm1.instance_name) n
outer apply(
      select cntr_value
      from sys.dm_os_performance_counters pm2
      where pm2.cntr_type = 1073939712
         and LOWER(pm1.counter_name) = LOWER(pm2.counter_name)
         and pm1.object_name = pm2.object_name
         and pm2.instance_name = pm1.instance_name
         ) base ;
so we are inserting to our table
when the date is the current date
using the DMV as filtering criteria
we should get only the stuff we want from our counters temp table
where these counters are in our baseline normal_hours table
and we are using base value if we need it
now after that date we are getting the name of the server
then after that the name of the counter type
then the counter name
then we are calculating each value
all the nullifs are to eliminate dividing by null
depending on the type, sometimes we can just get it like 65792
it just counts stuff so no issues there
272696576 calculates the difference between two of its snapshots so since the values obtained here are the same before and after it is 0
the nullif is there to counter the null issue, so we don’t have to divide by null
537003264 provides the fraction of something, so here you provide it with one snapshot
then with the other one
multiply it by your fraction that you want to calculate
and you will get the answer
the nullif does the same here
1073939712 is the base for the previous one that is why you outer apply it to the thing
so it is just a denominator
and that is it pretty much
now here the dates are the same so it is all about nulls
what if we provide snapshots to subtract from each other
and also we need normal hours activity
so we give them normal hours
we give them some counter date
then another date
then we subtract from each
and monitor the activity in between
now if we execute the temp tables twice then query dbo.counters we can see:
select*
from dbo.counters
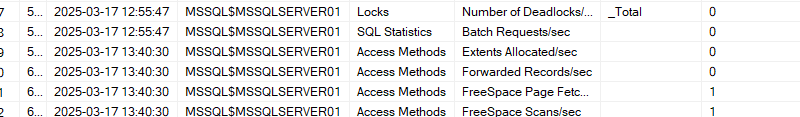
now as you can see the information is recorded on both timestamps
there is an hour between them
and it executes every 5 seconds
so it is up to you to do it how often do you like
you can schedule an agent job for this
now let’s assume that this is our baseline
and insert it into our normal_hours table
creating regular workload table
now let’s insert into the normal hours table:
create table dbo.counters_normal_hours(
id int identity(1,1),
start_date datetime2(0),
end_date   datetime2(0),
server_name varchar(128),
object_name varchar(128),
counter_name varchar(128),
instance_name varchar(128),
minimum_value float null,
maximum_value float null,
average_value float null,
standard_deviation_counter float null,
constraint pk_counters_normal_hours_id
primary key clustered (id)
)
now here we insert the same values, we add a start and an end date that we want to measure the difference in between
then we add three extra values to make it easier to read the table
something that we are familiar with from math classes or statistics
so we have to have some samples in order to analyze them
we have to have a baseline so we could exclude it from the results
if we did not have a baseline then we should start by collecting this week as a baseline
Test
now we did this:
go
use test_database
create table new_id_demo(
UserID uniqueidentifier not null default newid(),
purchase_amount int);
go
create clustered index ix_userid on new_id_demo(userid)
with( fillfactor = 100, pad_index =on);
go
with
n1(c) as (select 0 union all select 0 ),
n2(c) as (select 0 from n1 as t1 cross join n1 as t2),
n3(c) as (select 0 from n2 as t1 cross join n2 as t2),
n4(c) as (select 0 from n3 as t1 cross join n3 as t2),
n5(c) as (select 0 from n4 as t1 cross join n4 as t2),
ids(id) as (select row_number() over (order by (select null)) from n5)
insert into new_id_demo(purchase_amount)
select id*20
from ids;
create clustered index ix_userid on new_id_demo(userid)
with( fillfactor = 100, pad_index =on);
go 10go
use test_database
create table new_id_demo(
UserID uniqueidentifier not null default newid(),
purchase_amount int);
go
create clustered index ix_userid on new_id_demo(userid)
with( fillfactor = 100, pad_index =on);
go
with
n1(c) as (select 0 union all select 0 ),
n2(c) as (select 0 from n1 as t1 cross join n1 as t2),
n3(c) as (select 0 from n2 as t1 cross join n2 as t2),
n4(c) as (select 0 from n3 as t1 cross join n3 as t2),
n5(c) as (select 0 from n4 as t1 cross join n4 as t2),
ids(id) as (select row_number() over (order by (select null)) from n5)
insert into new_id_demo(purchase_amount)
select id*20
from ids;
create clustered index ix_userid on new_id_demo(userid)
with( fillfactor = 100, pad_index =on);
go 10
after that, we ran our script, now obviously in a regular workload you need to schedule an agent job for this
then we got some results
Querying the normal workload
now after that we should do this to insert to our baseline:
----
declare @start_time datetime ='2025-03-17 12:55:47',
        @end_time datetime = '2025-03-18 02:13:04'
insert into dbo.counters_normal_hours
(
start_date,
end_date,
server_name,
object_name,
counter_name,
instance_name,
minimum_value,
maximum_value,
average_value,
standard_deviation_counter
)
select min(counter_date),
       max(counter_date),
       server_name,
       object_name,
       counter_name,
       instance_name,
       min(new_counter_value),
       max(new_counter_value),
       AVG(new_counter_value),
       STDEV(new_counter_value)
from dbo.counters
where counter_date between @start_time and @end_time
group by server_name,object_name,counter_name,instance_name;
now this is not obviously a good baseline but we are just testing here
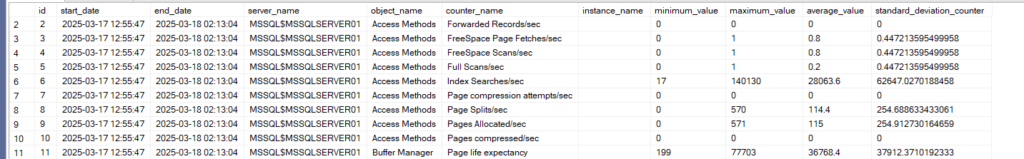
so if we select*:
select*
from dbo.counters_normal_hours
we get this
and with that, we are done here, see you in the next blog
[…] so using the scripts we provided here […]
[…] Now if we try to persist the counter using the scripts provided in our blog […]