
Now, today we are going to talk about one other PerfMon counter:
- Page Splits/sec
Now this one is on fragmentation and how many extents get allocated, and how often
which means how much index internal and external fragmentation
Persisting Page Splits/sec
To do that we need the following table created:
USE testing

create table newid1_demo(
UserID uniqueidentifier not null default newid(),
purchase_amount int);
----
create clustered index ix_userid on newid1_demo(userid)
with( fillfactor = 100, pad_index =on);
----
----------------inserts
with
n1(c) as (select 0 union all select 0 ),
n2(c) as (select 0 from n1 as t1 cross join n1 as t2),
n3(c) as (select 0 from n2 as t1 cross join n2 as t2),
n4(c) as (select 0 from n3 as t1 cross join n3 as t2),
n5(c) as (select 0 from n4 as t1 cross join n4 as t2),
ids(id) as (select row_number() over (order by (select null)) from n5)
insert into newid1_demo(purchase_amount)
select id*20
from ids;
select avg_fragmentation_in_percent
from sys.dm_db_index_physical_stats(db_id(),OBJECT_ID(N'dbo.newid1_demo'),null,null,null)
We would get the following:
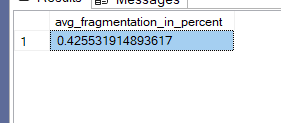
So when we first inserting, it is ordered without fragmentation, so we need to insert again while PerfMon page splits live is on like:
go
with
n1(c) as (select 0 union all select 0 ),
n2(c) as (select 0 from n1 as t1 cross join n1 as t2),
n3(c) as (select 0 from n2 as t1 cross join n2 as t2),
n4(c) as (select 0 from n3 as t1 cross join n3 as t2),
ids(id) as (select row_number() over (order by (select null)) from n4)
insert into newid1_demo(purchase_amount)
select id*20
from ids;
go 1010
we got
So as you can see, we have a lot of index fragmentation from these little inserts,
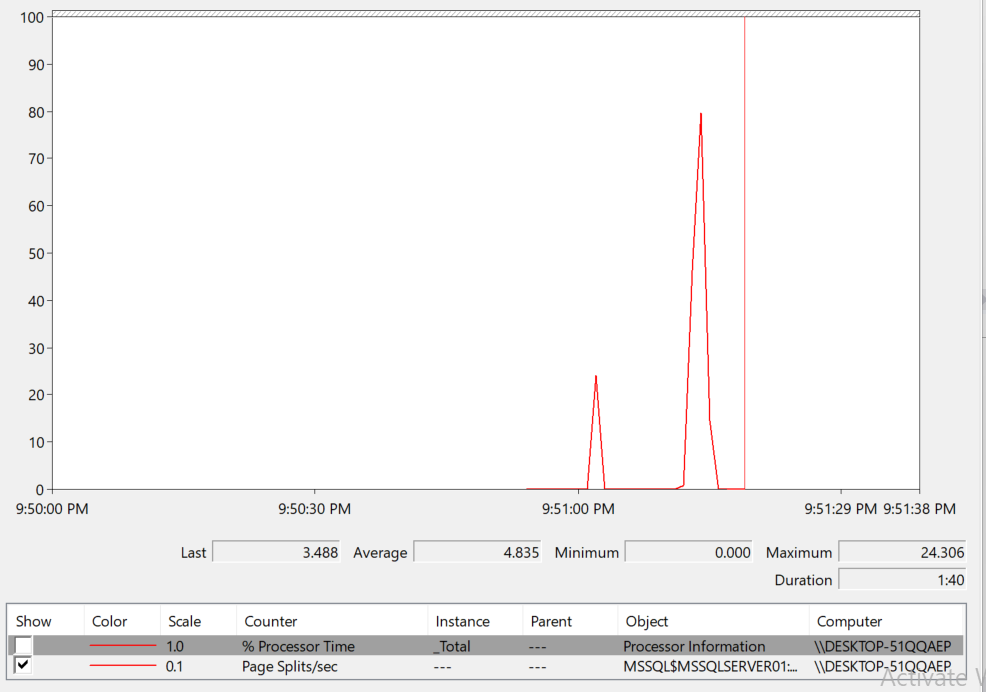
Now if we try to persist the counter using the scripts provided in our blog
So we ran SqlQueryStress since these inserts are so efficient
We would get:

Now as you can see, it recorded it
Now if we choose the start and end date like:
declare @start_time datetime ='2025-03-24 14:18:29',
        @end_time datetime = '2025-03-25 22:01:47'
We would get:

So sometimes during our testing we had none and sometimes we had 570Butt the average is 114
but the average is 114
So we have page splits
The next step is to record the DMOs and see our data using the index_dmo database
But before that we should know if any of these counters is significant
To do that we will use a subquery and do some calculations on the counters based on them:
use Perf_Mon
go
with page_split_calculations
as
(
select
counter_date,
server_name,
max(IIF(counter_name = 'Page Splits/sec',new_counter_value,null)) as page_splits,
max(IIF(counter_name = 'Batch Requests/sec',new_counter_value,null)) as batch_requests

from dbo.counters
where counter_name in('Page Splits/sec','Batch Requests/sec')
group by counter_date,server_name
)
select
min(page_splits) as min_split,
max(page_splits) as max_split,
avg(page_splits) as avg_split,
min(page_splits/(nullif(batch_requests,0)*1)) as min_split_to_batch,
max(page_splits/(nullif(batch_requests,0)*1)) as max_split_to_batch,
avg(page_splits/(nullif(batch_requests,0)*1)) as avg_split_to_batch,
format(1.* sum(iif(page_splits/(nullif(batch_requests,0)*1)>1,1,0)) /count(*),'0.00%') as percent_violation
from page_split_calculations
where counter_date >='2025-03-24 14:18:29'
group by server_name
We would get:
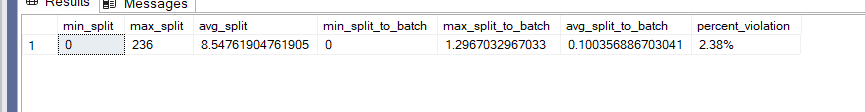
So even when we were testing, the page splits average was about 8 and a half, but sometimes we had a lot
And the percent violation was 2
now, here our threshold was 1, which is too sensitive, but for testing purposes, we kept it like this
As a rule of thumb, we can use 20
If in every batch we had above 20 splits, we would get 1
Now we monitor this and see how much it increases
Now to find the indexes that we are having an issue with we persisted operational and physical stats:
go
select QUOTENAME(DB_NAME(database_id)) as database_nam,
       QUOTENAME(OBJECT_SCHEMA_NAME(eo.object_id,eo.database_id)) + '.'+ QUOTENAME(OBJECT_NAME(eo.object_id,eo.database_id)) as object_with_schema,
       SUM(leaf_allocation_count) as leaf_allocation_count,
       sum(nonleaf_allocation_count) as nonleaf_allocation_count,
       max(iif(s.id = 1,avg_fragmentation_in_percent,null)) as the_end,
       avg(s.avg_fragmentation_in_percent) as avg_fragmentation
from dbo.index_operational_stats_everything eo
 cross apply(
             select DENSE_RANK() over(order by ep.recording_date) as id,
                   avg_fragmentation_in_percent
             from dbo.index_physical_stats_everything ep
             where ep.database_id = eo.database_id
             and ep.object_id = eo.object_id
             and ep.index_id = eo.index_id
             ) s
where database_id > 4-- no system databases
and eo.index_id<> 0 -- since we don't want heaps
and( leaf_allocation_count> 0
      or nonleaf_allocation_count>0
   )
group by object_id,database_id,eo.leaf_insert_count
order by eo.leaf_insert_count desc;
Now, here we used operational stats, since it shows which indexes have the most inserts and the physical to show the amount of fragmentation
other than that we explained all the other components in the previous blogs in tuning indexes series
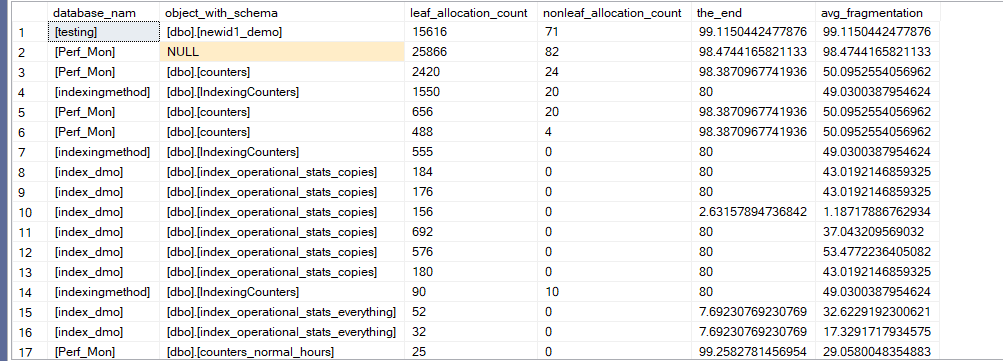
As you can see, the last index has a lot of fragmentation
Now the other two
They might, but since most of the time we don’t query them that much, we don’t care about them
now in order to get around the newid() function as a clustered index
we can newsequntialid()
checksum computed column if we absolutely need to
composite key instead of it
Or we can use an ever-increasing id, each has its own specific application that depends on our application requirement
and how to deal with fragmentation is explained in another blog in the storage engine series
So we are all covered here
And with that, we are done with this blog.