
The last blog was about forwarded records/sec counter in PerfMon, today we are going to discuss the counter full scans/sec, now this could be on a heap, clustered, or nonclustered index and it measures how many times it happened on a specific instance like other counters
we are going to record it in our Perf_Mon database
then after that calculate some ratios using CTE and some logic
we followed that by querying usage and physical stats so we could find the indexes
so we could dive from system to database to table level
Storing the counter
so using the scripts we provided here
we ran in SQL query stress this code:
use testing
select*
from dbo.heapVSclustered

select*
from dbo.forwarding
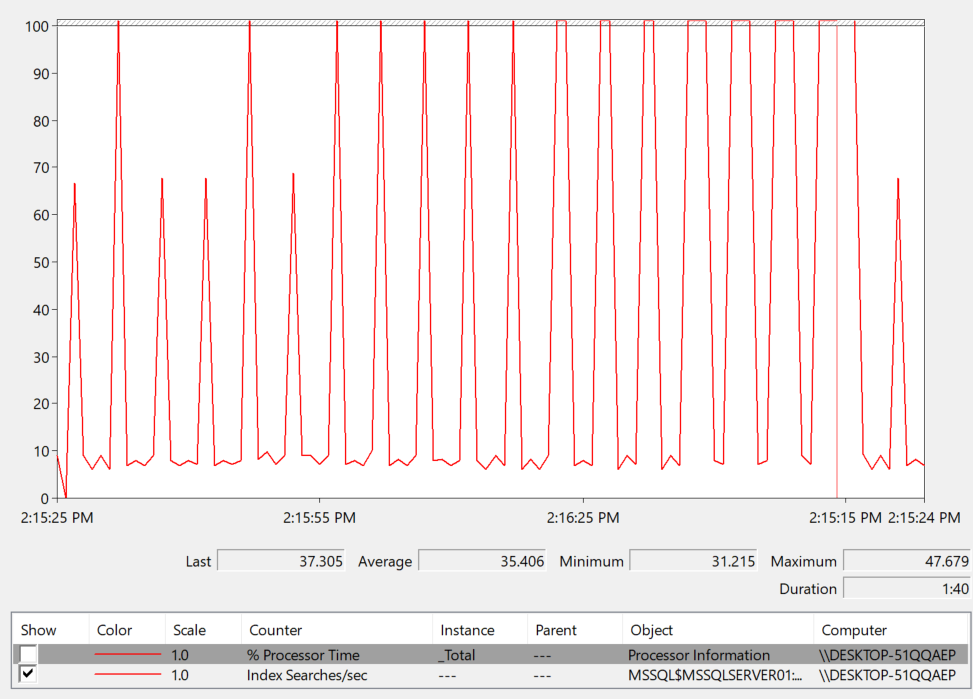
now while doing that we are going to watch the live data in PerfMon
so:
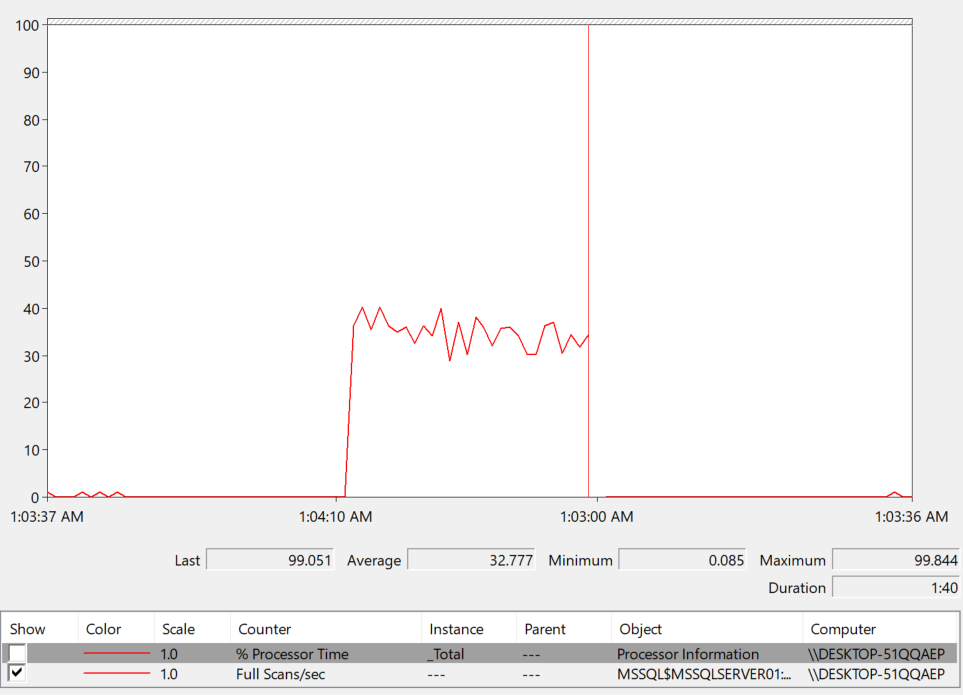
as you can see there is a spike here while testing
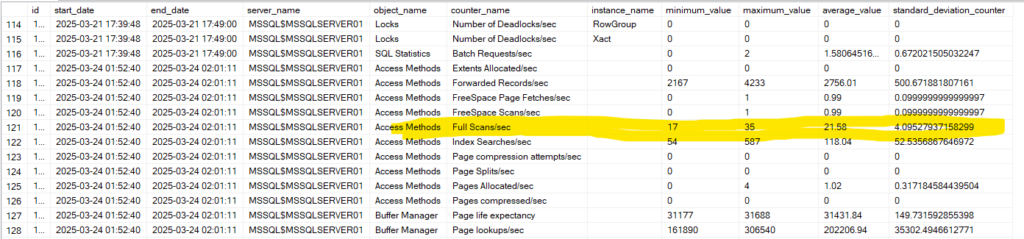
so while running this if you run the script provided in the above mentioned blog between
@start_time datetime ='2025-03-24 01:40:00',
@end_time datetime = '2025-03-24 02:01:11'
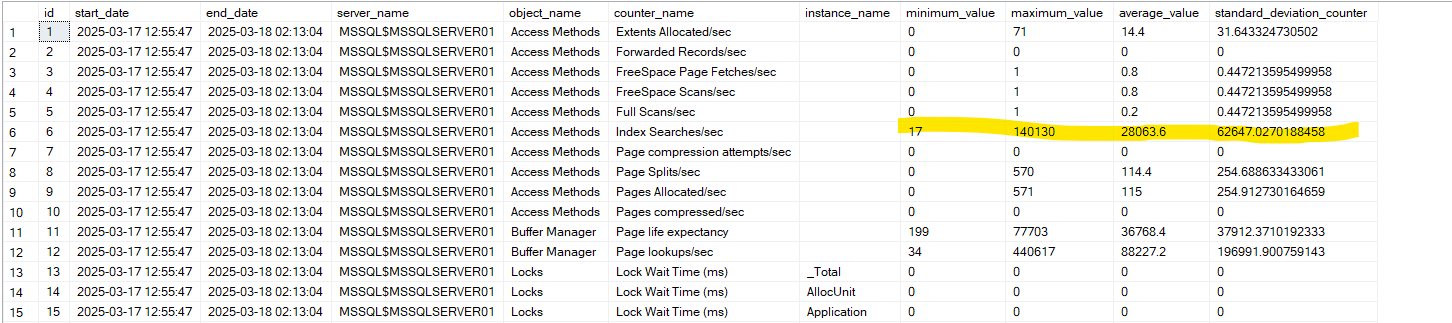
keep in mind we ran every 5 seconds for the entire duration, so every 5 seconds had one of these values:
now we can look at it like this, or we could do what we did before, generate some calculations based on the snapshots values from dbo.counters like:
use Perf_Mon
go
with scans_calculations as
(
select
      counter_date,
      server_name,
      max
      (
       iif
         (
           counter_name = 'Full Scans/sec',new_counter_value,null
         )
      )
      as fullscan,
      max
        (
         iif
           (
           counter_name = 'Batch Requests/sec',new_counter_value,null
           )
        )
        as batch_request
from dbo.counters
where counter_name in('Batch Requests/sec','Full Scans/sec')
group by counter_date,server_name
)
select format
             (
             1.*sum(
                    IIF
                       (
                       fullscan/(nullif(
                                       batch_request,0
                                       )
                               * 1)>1,1,0
                       )
                   )
             /count(*),'0.00%'
             )as percent_violation
from scans_calculations
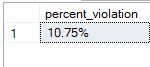
now at the end, the percent violation means, what is the percentage of full scans relative to batch requests
it started with format
which gives it the 0.00% format
the 1. so we could get full decimal values, full floats not just rounded up stuff
the divided by the count so we could get the avg
the iif contains the actual division of full scan count on batch request
and with that you get the actual count or violation
now this is too low for a threshold but after we executed it we got:
now if we query like the following:
use Perf_Mon
go
with scans_calculations as
(
select
      counter_date,
      server_name,
      max
      (
       iif
         (
           counter_name = 'Full Scans/sec',new_counter_value,null
         )
      )
      as fullscan,
      max
        (
         iif
           (
           counter_name = 'Batch Requests/sec',new_counter_value,null
           )
        )
        as batch_request
from dbo.counters
where counter_name in('Batch Requests/sec','Full Scans/sec')
group by counter_date,server_name
)
select
       min(fullscan) as min_fullscan,
       avg(fullscan) as avg_fullscan,
       max(fullscan) as max_fullscan,
       min(fullscan/(nullif(batch_request,0))) as min_fullscan_ratio,
       avg(fullscan/(nullif(batch_request,0))) as avg_fullscan_ratio,
       max(fullscan/(nullif(batch_request,0))) as max_fullscan_ratio,
       format
             (
             1.*sum(
                    IIF
                       (
                       fullscan/(nullif(
                                       batch_request,0
                                       )
                               * 1)>1,1,0
                       )
                   )
             /count(*),'0.00%'
             )as percent_violation
from scans_calculations
group by server_name
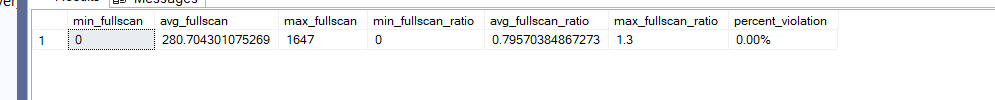
we would get:

so as you can see 10 percent is fullscan
we have a pattern that tends to go toward the higher end
so it might be an issue considering this threshold
however, if we multiply it by a 1000
like:
go
with scans_calculations as
(
select
      counter_date,
      server_name,
      max
      (
       iif
         (
           counter_name = 'Full Scans/sec',new_counter_value,null
         )
      )
      as fullscan,
      max
        (
         iif
           (
           counter_name = 'Batch Requests/sec',new_counter_value,null
           )
        )
        as batch_request
from dbo.counters
where counter_name in('Batch Requests/sec','Full Scans/sec')
group by counter_date,server_name
)
select
       min(fullscan) as min_fullscan,
       avg(fullscan) as avg_fullscan,
       max(fullscan) as max_fullscan,
       min(fullscan/(nullif(batch_request,0))) as min_fullscan_ratio,
       avg(fullscan/(nullif(batch_request,0))) as avg_fullscan_ratio,
       max(fullscan/(nullif(batch_request,0))) as max_fullscan_ratio,
       format
             (
             1.*sum(
                    IIF
                       (
                       fullscan/(nullif(
                                       batch_request,0
                                       )
                               * 1000)>1,1,0
                       )
                   )
             /count(*),'0.00%'
             )as percent_violation
from scans_calculations
group by server_name
we would get:
not every counter should be treated the same, having a lot of forwarded pointers may be an issue, but just scanning an index or a table might be the right move for a lot of queries
so we should not be looking at them unless they are really high kind of like most of the workload
again these are general pointers, so maybe you want all seeks, then you can dynamically adjust it like we did
now that we identified the systemic issue, we need to identify where are these scans happening, is they indexes or heaps, why, are the indexes any good, do we need to add some
to do that:
go
use index_dmo
go
select
QUOTENAME(DB_NAME(eu.database_id)) as database_name,
QUOTENAME(OBJECT_SCHEMA_NAME(eu.object_id,eu.database_id)) +'.'+ QUOTENAME(OBJECT_NAME(eu.object_id,eu.database_id)) as object_with_schema,
eu.index_id,
sum(eu.user_scans) as scans,
sum(eu.user_seeks) as seeks,
s.record_count
from dbo.index_usage_stats_everything eu cross apply
            (
             select

                   DENSE_RANK() over( order by ep.recording_date desc) as id,
                   ep.record_count
                   from dbo.index_physical_stats_everything ep
                   where eu.database_id = ep.database_id
                   and eu.object_id = ep.object_id
                   and eu.index_id = ep.index_id
            ) s
where
        eu. database_id >4
        and object_name(eu.object_id,eu.database_id) is not null
        and s.id = 1
group by eu.database_id, eu.object_id,eu.index_id,s.record_count
order by sum(eu.user_scans)*s.record_count desc;
now let’s break down what we did here
so we want to know what indexes are being used the most, and how many scans they have
we don’t do system database at first so database_id>4
and we want the database with highest record count*the highest scan to be first so that is the order by
so we looked at usage stats
so we got their names, their databases, their schema, how many scans and seeks they have
and their record count
we grouped them by their unique attributes database_id, object_id, and then index_id
and we needed the record count so we could group and order by it
and where we can get that
from physical stats
so we have to cross apply by that
which is a left semi outer join so we got all the results from the left plus the right
we also did not want any null database_id or object_id name, meaning if the object_name for an index is not there, maybe because it is internal, we don’t want it so don’t show it, since we can’t control it
and with that we got the following results:
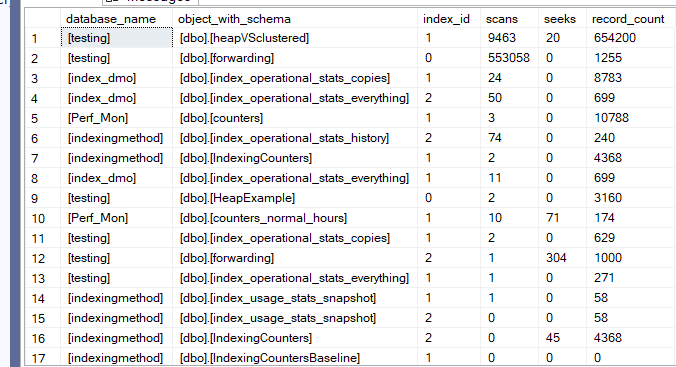
as you can see, the indexes that we ran tests on are the most commonly used, and since we used a lot of select* queries, we need to modify our query practices, or if we have a bi practice, then we should consider colmnstore indexes and their warehousing solution
but once we did this we get to the bottom of the thing
or we see a heap, kind of like in forwarding, so we could use a clustered index, so the data does not have a forwarding, less records and pages, less io, better performance
or more nonclustered
or a char instead of a varchar
or something else
but with this we know the potential issue so we could fix it
or we could at another performance counter, the index searches/sec
Index Searches/sec counter
this counter identifies seeks
so if we do the following while watching the live monitor in PerfMon in SqlQueryStress:
use testing
select*
from dbo.heapVsClustered
where id >10
now if we go to the database Perf_Mon that we introduced in the above mentioned blog and select into the snapshots we get the following:
in the normal_hours table when we calculate deltas between two dates
obviously here it recorded the index searches = seeks for us, just like we saw before
now we have to do some calculations here:
use Perf_Mon
go
with seeks_calculations as
(
select
counter_date,
server_name,
max
   (
    iif
      (
       counter_name = 'Index Searches/sec',new_counter_value,null
      )
   ) as index_searches,
max
   (
    iif
      (
       counter_name = 'Full Scans/sec',new_counter_value,null
      )
   ) as fullscans
from dbo.counters
where counter_name in ('Index Searches/sec','Full Scans/sec')
group by counter_date,server_name
)
select
     min(index_searches) as index_searches_min,
     avg(index_searches) as index_searches_avg,
     max(index_searches) as index_searches_max,
     min(index_searches/(nullif(fullscans,0)*1)) seek_to_scan_min,
     max(index_searches/(nullif(fullscans,0)*1)) seek_to_scan_max,
     avg(index_searches/(nullif(fullscans,0)*1)) seek_to_scan_avg,
     format
          (
          1.*sum
               (
               iif
                  (
                  index_searches/(nullif(fullscans,0)*1)>1,1,null
                  )
               )/count(*)
               ,
               '0.00%'
          ) as percent_violation
from seeks_calculations
where counter_date between '2025-03-24 14:00:00' and '2025-03-24 14:18:35'
group by server_name
we explained all of these before so no need to go over them again
but we got the same threshold issue for fullscans too
here we multiplied by 1
this is too low for a threshold
the output was like:

so here, even though, we had mostly seeks the percent violation still high, meaning there are a lot of scans, but if we adjust like the following:
use Perf_Mon
go
with seeks_calculations as
(
select
counter_date,
server_name,
max
   (
    iif
      (
       counter_name = 'Index Searches/sec',new_counter_value,null
      )
   ) as index_searches,
max
   (
    iif
      (
       counter_name = 'Full Scans/sec',new_counter_value,null
      )
   ) as fullscans
from dbo.counters
where counter_name in ('Index Searches/sec','Full Scans/sec')
group by counter_date,server_name
)
select
     min(index_searches) as index_searches_min,
     avg(index_searches) as index_searches_avg,
     max(index_searches) as index_searches_max,
     min(index_searches/(nullif(fullscans,0)*1000)) seek_to_scan_min,
     max(index_searches/(nullif(fullscans,0)*1000)) seek_to_scan_max,
     avg(index_searches/(nullif(fullscans,0)*1000)) seek_to_scan_avg,
     format
          (
          1.*sum
               (
               iif
                  (
                  index_searches/(nullif(fullscans,0)*1000)>1,1,null
                  )
               )/count(*)
               ,
               '0.00%'
          ) as percent_violation
from seeks_calculations
where counter_date between '2025-03-24 14:00:00' and '2025-03-24 14:18:35'
group by server_name
the output was like:

it is meaningless, no need even to take a look
now here what we are doing is: identifying the queries that have less than 1000 seeks per scan
so there are no queries like this
but if it was 1 scan per seek, then we have almost equivalent amount
but this is not our concern
not after we find that we have too many scans
we can look at the previous counter
and see if any of the full scan related indexes is not indexed enough, like the heap, or the dbo.heapvsclustered
so maybe we could create a covering index
or modify query practices
or create a different clustered
or create a clustered for a heap
or…..
now how could we identify the indexes with the percent violation
we could do the following:
go
use index_dmo
go
select
QUOTENAME(DB_NAME(eu.database_id)) as database_name,
QUOTENAME(object_schema_name(eu.object_id, eu.database_id)) + '.' + QUOTENAME(OBJECT_NAME(eu.object_id,eu.database_id)),
eu.index_id,
sum(eu.user_scans) as scans,
sum(eu.user_seeks) as seeks,
1.*sum(eu.user_seeks)/nullif(sum(eu.user_scans),0) as seek_to_scan_ratio,
s.record_count
from dbo.index_usage_stats_everything eu cross apply (
                select DENSE_RANK() over(order by ep.recording_date desc ) id ,
                       ep.record_count
                from dbo.index_physical_stats_everything ep
                where ep.database_id = eu.database_id
                and ep.object_id = eu.object_id
                and ep.index_id = eu.index_id
                ) s
where database_id > 4
and s.id = 1
and s.record_count > 0
group by eu.database_id,eu.object_id,eu.index_id,s.record_count
having 1.*sum(eu.user_seeks)/nullif(sum(eu.user_scans),0) < 1000
and sum(eu.user_seeks) > 0
order by 1.*sum(eu.user_seeks)/nullif(sum(eu.user_scans),0) desc, sum(eu.user_seeks) desc, s.record_count desc
now here what we want is to get the names of the objects = indexes we want plus their schemas
to compare their seek to scan ratio
since we are looking at the objects now
so we got them from our persisted index usage stats
from every database except system database
where the physical stats date is the last, since we were trying to measure the last spike in workloads
we wanted to group them by definition and record count w
where they have rows so if the don’t have rows we don’t need them
having their ratios of seeks on scans less than 1000
since if there are 1000 seeks per scan, then we don’t have an issue
and the seeks are more than 0 since if we don’t have seeks on it, then this data should not be considered here
we order them by ratios, user seeks and record count
and we got this:
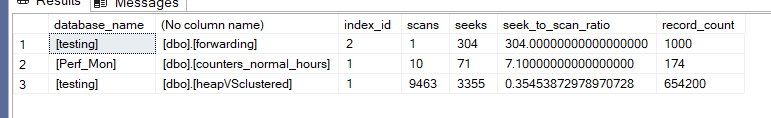
so as you can see, the testing table, had the most rows, but the least ratio
so there were a lot of scans, but we know from our previous blog, in the SqlQueryStress we asked for too many select*s otherwise there is no issue
but if we had an issue, we should look into it by either running extended events, looking at query store, or looking at the cache
and we did all of that in our blog on troubleshooting blocking and deadlocks.
and with that, we end out blog today, catch in the next one.