
Hi everyone, today we are going to introduce some of the techniques used in diagnosing query performance issues:
- Execution plans
- Statistics
- DMVs
- extended events
warning: this blog is meant for teaching purposes and should not be used in a production enviroment unless the user is exprienced.
Execution Plan
the primary method used in interacting with the query optimizer
it could be graphical, XML, or text.
the all contain the same information
some could be more detailed than others
each could be an estimated plan = the plan generated by the optimizer = before the execution of the query based on transformation rules and statistics created by the optimizer, SQL server tries to guess how it could execute the query in the most efficient way.
we don’t need to run the query to get it we could just ask for the plan and it would be generated
if used OPTION(RECOMPILE) SQL server would generate a different plan every time it gets executed
so we might see a different result every time we ask for the plan
and there is the actual execution plan = what happened after we use the estimated
it is the actual execution metrics
it is generated by the execution engine while executing the query
you can’t see it until the query gets executed
Graphical plan
it is the one with pretty colors and shapes
we could ask for it in different ways
we could use SSMS to generate it for example:
use AdventureWorks2022

BEGIN TRAN
SELECT ProductID
FROM Production.Product
where ProductID <> 3 ;
COMMIT TRAN
And before executing the query press on display estimated execution plan
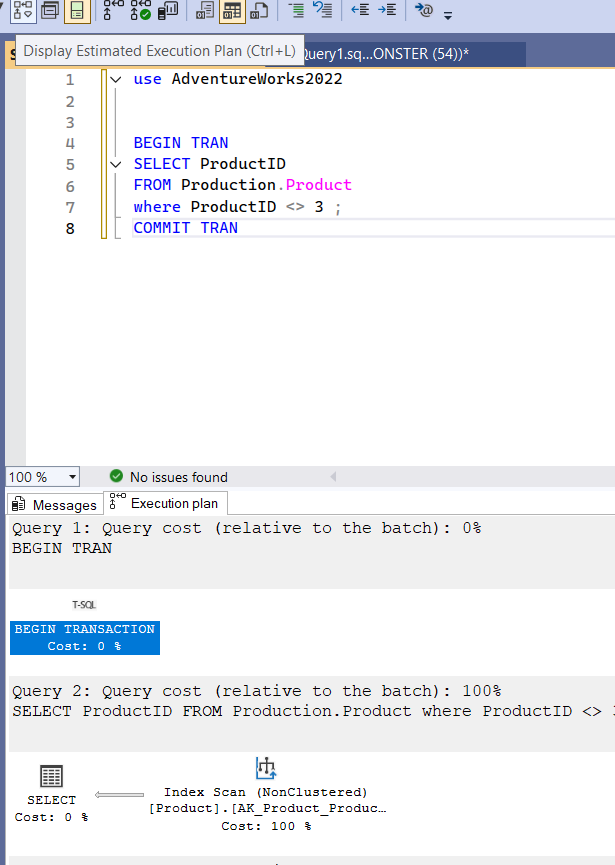
and it would pop up immediately or you could include it after execution by clicking on include,
and you could show the actual execution plan by clicking on include actual query statistics
then execute:
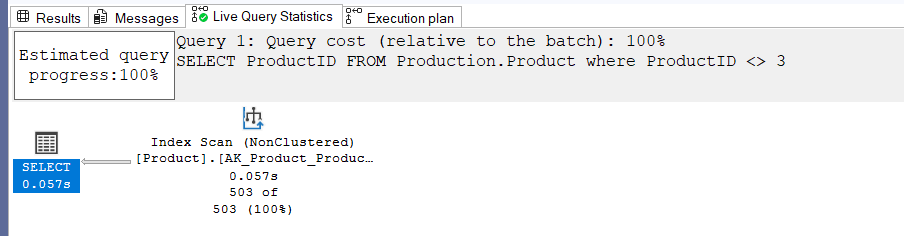
here we can see the actual execution plan,
the last tab includes what the optimizer had in mind when started
live query statistics include what is happening right now
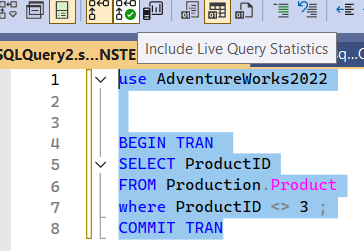
now if we run a query that takes a long time to run like (adam machanic’s enlarged adventure works):
BEGIN TRAN
SELECT*
FROM Sales.SalesOrderHeaderEnlarged SOH INNER JOIN Sales.SalesOrderDetailEnlarged SOD
                                        ON SOD.SalesOrderID = SOH.SalesOrderID
COMMIT TRAN
While executing we could see
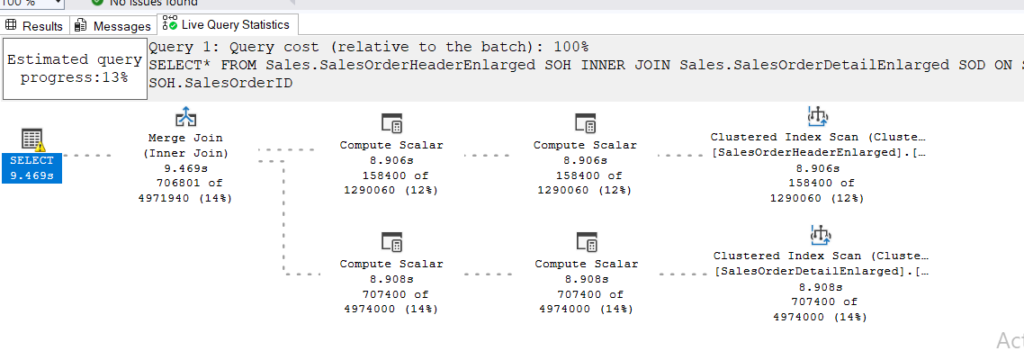
so only 13 percent was done but it shows us what is going on right now
each node we see here represents an operator.
physical operator( we talked about it in more detail in the previous blog the query optimizer) = the algorithm used by the execution engine to implement a specific logical operator, logical operator = the relational expression of the request = the interpretation of the SQL code to a more understandable form for the engine
so we have the physicals here, which is the implementation of our SQL code by the engine
for example the index scan here is a physical operator it first started as our select* statement
then it got converted to the logical operators select and get( more on it in the previous blogs)
then the query optimizer chose to make a range scan= index scan through transformation rules
and now we see it in the execution plan as a clustered index scan
or it could be a logical one like the select operator in the right
we could read the execution plan from the left to the right, , meaning here from the index scan to the select operator
or we could read it from the right to the left
but when the execution starts from the right
for example:
BEGIN TRAN
SELECT ProductID, Production.Product.ProductModelID
FROM Production.Product INNER JOIN Production.ProductModel
                         ON Production.Product.ProductModelID = Production.ProductModel.ProductModelID
WHERE Production.Product.ProductID = 3
COMMIT TRAN
The execution plan:
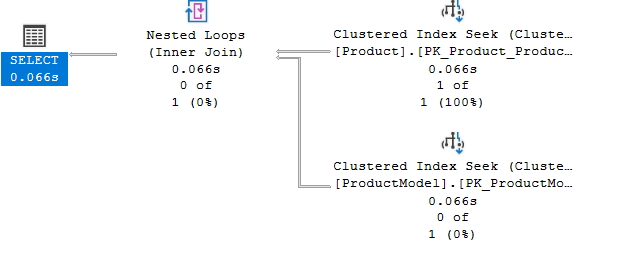
so here the execution engine looks at the rightmost operator: SELECT
sees what it wants= which rows= row at a time
then it points with the arrow to its child operators or operator in this case: the nested loop join
and asks him for the information
the nested loop join goes to his child operators the index seeks
and see if they match the conditions he wants one row at a time
and each index seek gets the row in question if it matches
and then sends it to the nested loop
who sends it to the parent node = operator select
so as you can see we can read it both ways
it is easier to start from the left
so we have an index that seeks some rows
and sends them to the join
who sees if they match the conditions requested
then sends the information to the parent node
which displays the results
so the parent node does the following operations:
- open() the operator to initialize it so it could set up any needed data structures so here the execution opened the select which opened the nested loop which…..
- getrow() from the child operator so here it told the nested loop to get the row one at a time which …..
- close() if it is done doing the query it closes up the child operator and closes itself
but the actual execution happens from right to left
now if we hover over any operator
we will see the tooltip
which is basic information about the node in question
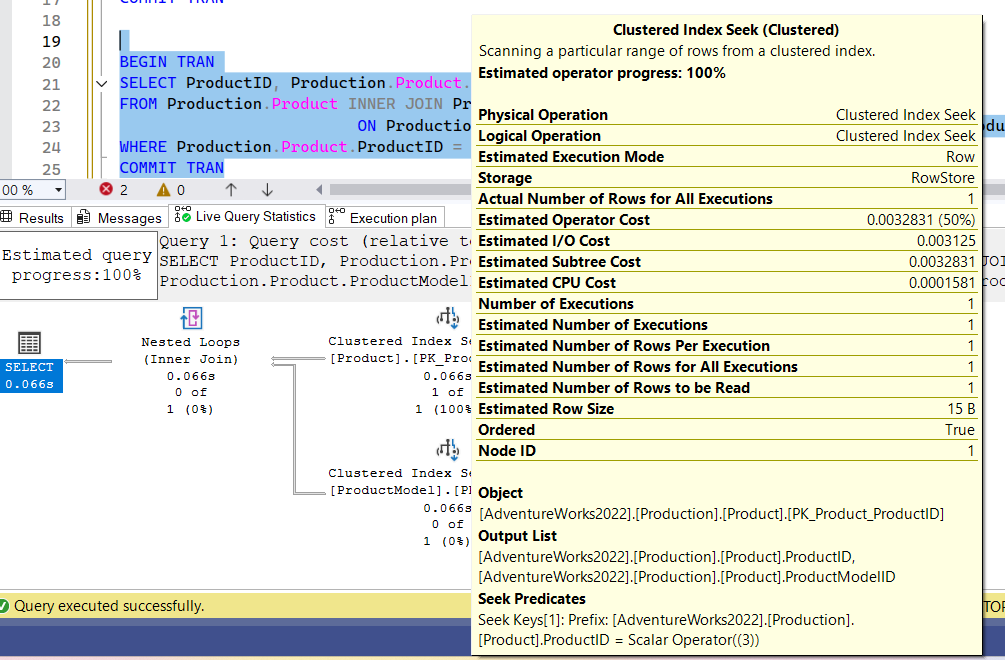
so here it shows the name of the logical and physical operator in question,
execution mode: row = it processes the data row at a time ( batch mode processes them in groups like hundreds or thousands)
storage = rowstore = stores each row as a physically independent entity(columnstore stores them in columns)
number of execution: how many times this node will be executed
number of rows per execution, number of rows for all execution …
and the costs, cost here is based on some device in Microsoft, it is not based on our current hardware, it is unitless, meaning the current cost is internal to SQL server, meaning it could be used to compare the same query performance between plans, but we can’t use in troubleshooting across queries or systems( more on that in another blog)
estimated subtree cost includes the cost of the operator itself and anything that branches from it so the select operator has the total cost and the nested loop has the cost of its seek children
and the seek has their own costs
node id: the id of the node in the current execution plan
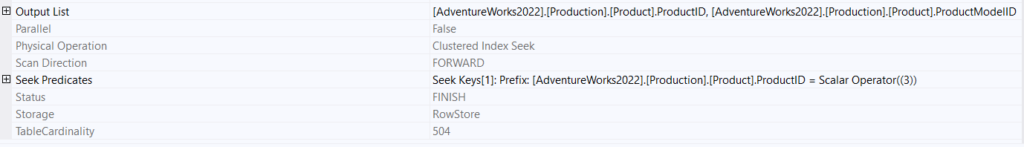
so here this index seek got one row that matches the conditions provided at the bottom
now this is not the information there is, if we want more we could look into the properties
we could right click on the node in question and click on properties
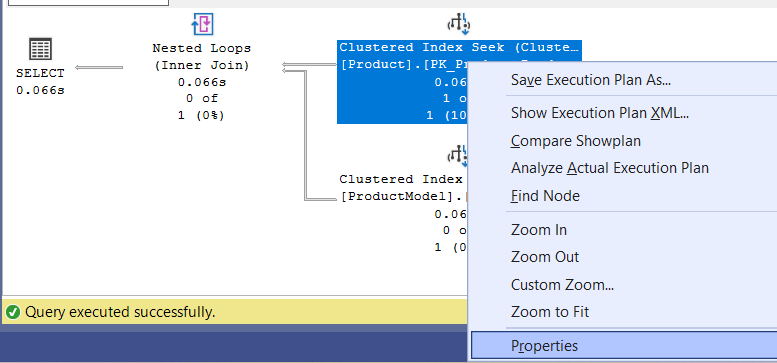
and this would pop up:
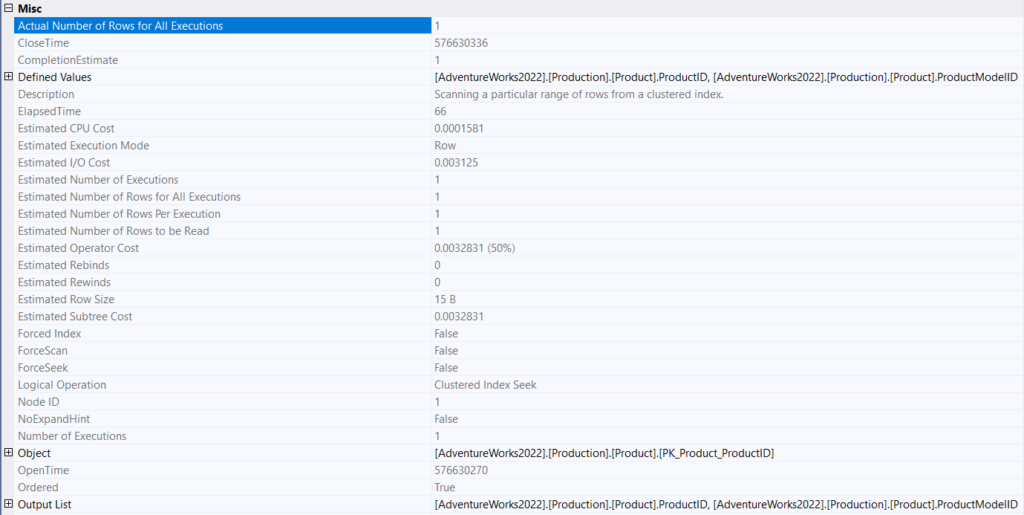
clostime: when did the close function has been issued to stop producing rows
completion estimate: how much of it is done
defined values:
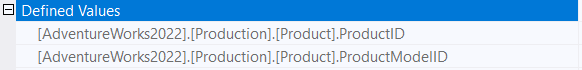
here it shows what values we defined to be requested to get from this specific operator
description: brief intro to what this operator does
elapsed time: in milliseconds
costs are internal values produced by SQL server, not to be confused with any other metric, they are unitless
forceseek: whether we used a query hint to force these specific operations
objects: defines which objects were used in the query(table, view etc.)
opentime: when did we request the open function to get rows
ordered: did we use an order by, or a key that orders the data like a clustered index
outputlist: shows the definition of the output provided by the query
Parallel: whether we used a parallel or serial plan
scan direction: whether we started from the last value in the order of the index page or from the first
seek predicates: the filters of the join and the where clause in here = how did we seek the index here for example
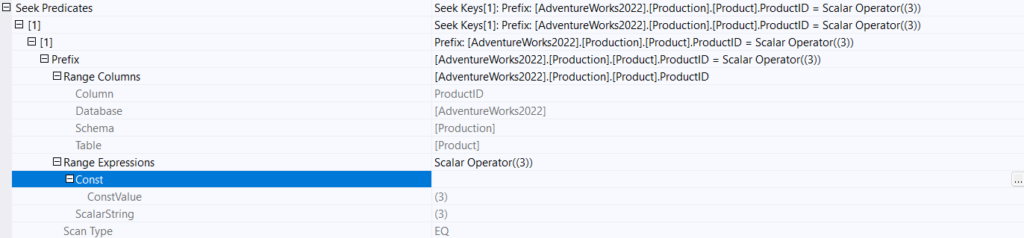
the columns is the one we defined and it is compared against a constant, it used a scalar operator eq meaning equality which was 3, so it seemed the row that equals 3 in the columns as you can see
cardinality estimation: more on it later
now if we select the properties of the select operator:
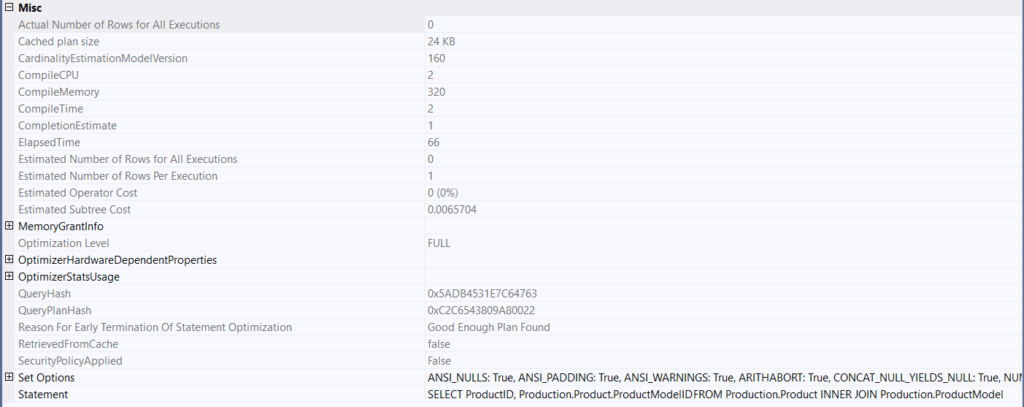
Cached plan size: the size of the plan in memory
Cardinality estimation model version: which version of the cardinality estimator are we using
compile CPU: the cost of compiling this specific plan
optimization level: whether it used a trivial plan or not ( more on it in the previous blog) but basically it means is the plan being used is very straightforward to the point that it does not need optimization
or not
query hash: a code generated by looking at the text of the query and used to identify similar queries
query plan hash: same but instead of the text it is for the execution plan
retrieved from cache: was this plan in memory?
set options: which SQL standards were applied mostly not relevant to anyone
statement: SQL text
optimizer stats usage: more on it later
now this is one way to get it the plan through SSMS but we can request it through code
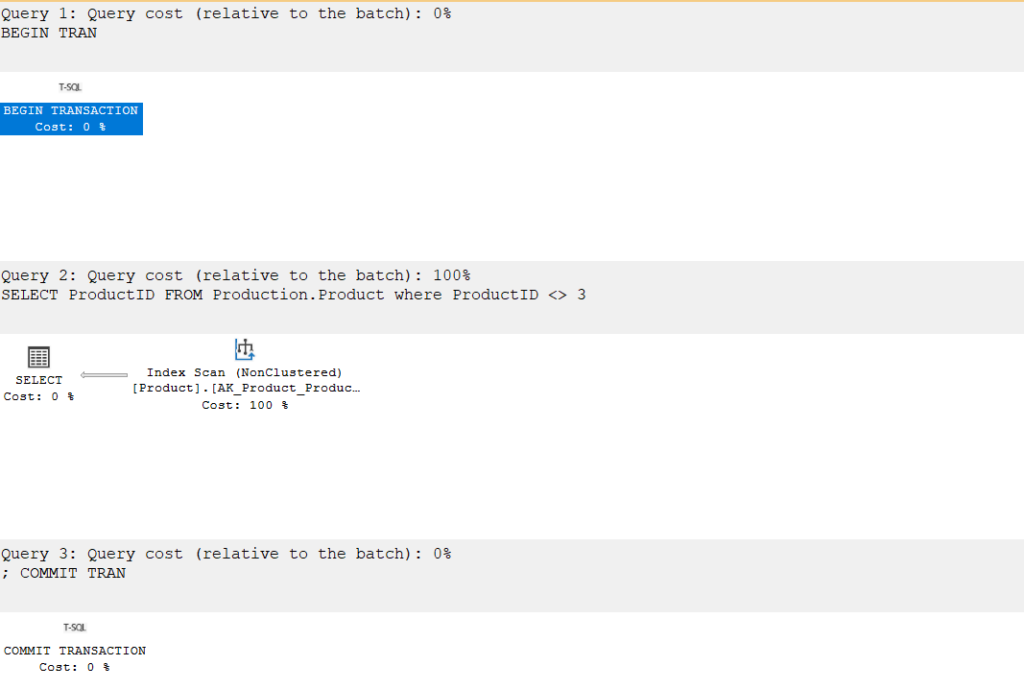
for example, for the display of the estimated plan before execution, we could:
SET SHOWPLAN_XML ON;

GO

BEGIN TRAN
SELECT ProductID
FROM Production.Product
where ProductID <> 3 ;
COMMIT TRAN

GO
SET SHOWPLAN_XML OFF;
GO
And we would get:
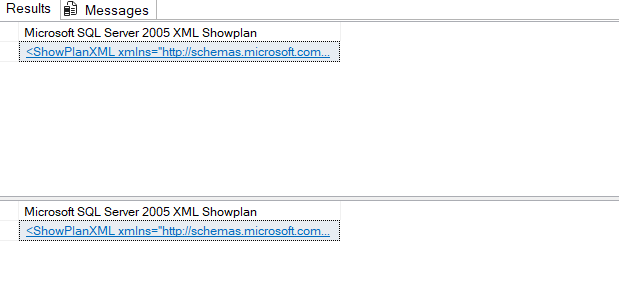
click on the second one
to show the actual execution of the plan we could:
SET STATISTICS XML ON;
GO

BEGIN TRAN
SELECT ProductID
FROM Production.Product
where ProductID <> 3 ;

COMMIT TRAN
GO

SET STATISTICS XML OFF;
GO
and this would pop up:
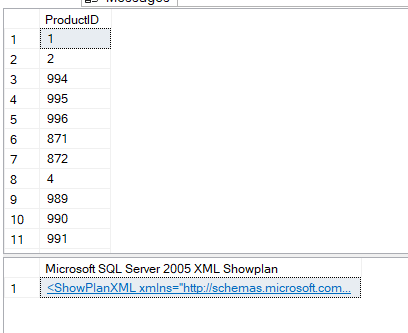
if we click on the XML we can see the plan
XML plan
now if we right click on any of the graphical plans:
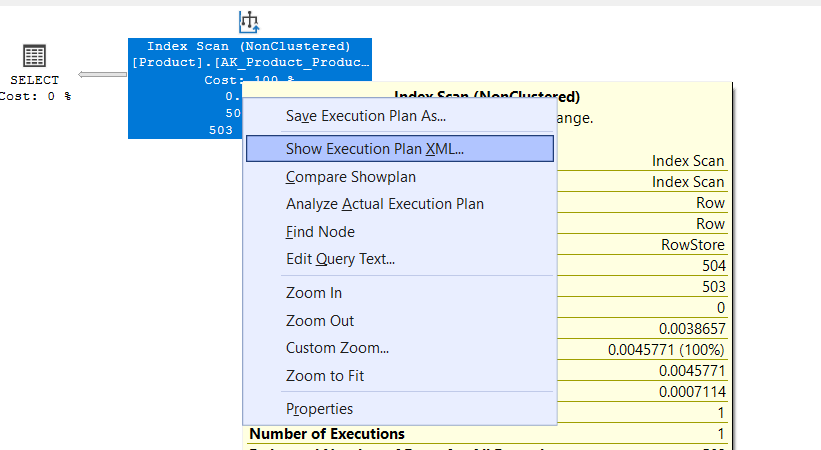
we could see the XML :
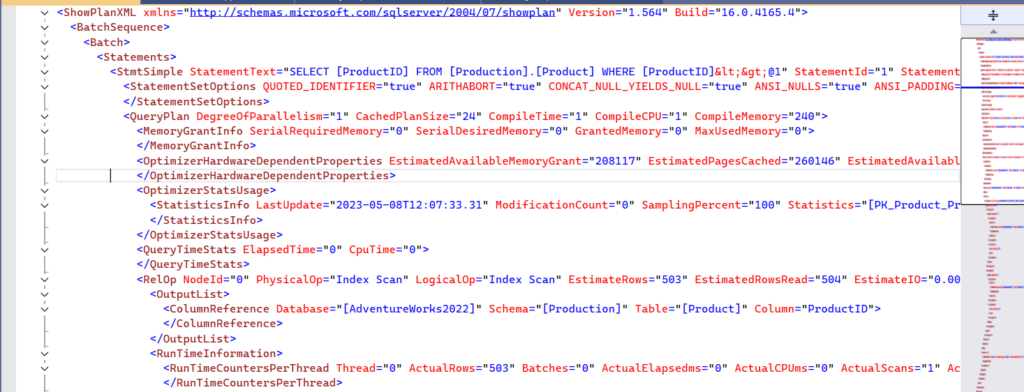
let’s walk through the output:
<ShowPlanXML xmlns="<http://schemas.microsoft.com/sqlserver/2004/07/showplan>"
 Version="1.564" Build="16.0.4165.4">

</ShowPlanXML>
now here it shows the root node and what it contains, it references the plan we are using and data related to it
and between it everything this specific plan contains
<BatchSequence>
    <Batch>
      <Statements>

    </Batch>
  </BatchSequence>
what does this specific batch of XML contains, it obviously contains the statements here
<StmtSimple StatementText="SELECT [ProductID] FROM [Production].[Product] WHERE [ProductID]<>@1"
StatementId="1" StatementCompId="2"
StatementType="SELECT" RetrievedFromCache="false"
StatementSubTreeCost="0.00457714" StatementEstRows="503"
SecurityPolicyApplied="false" StatementOptmLevel="FULL"
QueryHash="0xD9480B53E4485BC3" QueryPlanHash="0x8603CD27C55A3052"
StatementOptmEarlyAbortReason="GoodEnoughPlanFound"
CardinalityEstimationModelVersion="160">
</StmtSimple>
</Statements>
here it provides details related to this specific statement of SQL
we saw most of details in the graphical plan
but we did not talk about StatementOptmEarlyAbortReason which means why the query optimizer stopped the optimization( more on it in the previous blog) but here it means that i found in the time defined by the optimizer a plan that fits the estimated costs so it settled for it= good enough plan
<StatementSetOptions QUOTED_IDENTIFIER="true"
ARITHABORT="true" CONCAT_NULL_YIELDS_NULL="true"
ANSI_NULLS="true" ANSI_PADDING="true" ANSI_WARNINGS="true"
NUMERIC_ROUNDABORT="false">
          </StatementSetOptions>
now here it shows SQL Standards and which ones were used in here
<QueryPlan DegreeOfParallelism="1"
CachedPlanSize="24"
CompileTime="1" CompileCPU="1"
CompileMemory="240">

          </QueryPlan>
now here it shows more details related to the plan in question
we talked about these above :
<MemoryGrantInfo SerialRequiredMemory="0"
SerialDesiredMemory="0"
GrantedMemory="0" MaxUsedMemory="0">
            </MemoryGrantInfo>
same as the graphical
 <OptimizerHardwareDependentProperties EstimatedAvailableMemoryGrant="208117"
  EstimatedPagesCached="260146" EstimatedAvailableDegreeOfParallelism="8"
   MaxCompileMemory="20431456">
            </OptimizerHardwareDependentProperties>
same
<OptimizerStatsUsage>
              <StatisticsInfo
               LastUpdate="2023-05-08T12:07:33.31"
               ModificationCount="0"
               SamplingPercent="100"
               Statistics="[PK_Product_ProductID]"
               Table="[Product]"
               Schema="[Production]"
               Database="[AdventureWorks2022]">
              </StatisticsInfo>
            </OptimizerStatsUsage>
same or more we will talk more about statistics in another blog
<QueryTimeStats ElapsedTime="0" CpuTime="0">
            </QueryTimeStats>
same
<RelOp NodeId="0"
PhysicalOp="Index Scan"
 LogicalOp="Index Scan"
 EstimateRows="503"
 EstimatedRowsRead="504"
  EstimateIO="0.00386574"
  EstimateCPU="0.0007114"
   AvgRowSize="11"
   EstimatedTotalSubtreeCost="0.00457714"
   TableCardinality="504" Parallel="0"
    EstimateRebinds="0" EstimateRewinds="0"
     EstimatedExecutionMode="Row">

            </RelOp>
now here it is going to list the operators related to this specific plan
so we have an index scan as a physical and a logical one
then the other stuff is the same
<OutputList>
                <ColumnReference Database="[AdventureWorks2022]"
                Schema="[Production]" Table="[Product]" Column="ProductID">
                </ColumnReference>
              </OutputList>
now here it references the scan in the instance
it is the same as the outputlist in the graphical plan
 <RunTimeInformation>
                <RunTimeCountersPerThread Thread="0"
                ActualRows="503"
                Batches="0" ActualElapsedms="0"
                ActualCPUms="0" ActualScans="1"
                 ActualLogicalReads="4" ActualPhysicalReads="0"
                 ActualReadAheads="0" ActualLobLogicalReads="0"
                 ActualLobPhysicalReads="0" ActualLobReadAheads="0"
                 ActualRowsRead="504" ActualEndOfScans="1" ActualExecutions="1" ActualExecutionMode="Row">
                </RunTimeCountersPerThread>
              </RunTimeInformation>
now here it contains more information than the graphical but similar ones
we saw the same detail in the graphical
 <IndexScan Ordered="0"
 ForcedIndex="0"
 ForceSeek="0"
 ForceScan="0"
 NoExpandHint="0"
 Storage="RowStore">

              </IndexScan>
here it starts defining the properties of the operator same as execution
<DefinedValues>
               <DefinedValue>
                    <ColumnReference Database="[AdventureWorks2022]"
                    Schema="[Production]" Table="[Product]" Column="ProductID">
                    </ColumnReference>
                  </DefinedValue>
                </DefinedValues>
same as graphical
<Object Database="[AdventureWorks2022]" Schema="[Production]"
 Table="[Product]" Index="[AK_Product_ProductNumber]"
 IndexKind="NonClustered" Storage="RowStore">
                </Object>
same as graphical
<Predicate> </Predicate>
now here it includes a little bit more information about the logical scalar operators used
<ScalarOperator ScalarString="[AdventureWorks2022].[Production].[Product].[ProductID]<(3)
OR [AdventureWorks2022].[Production].[Product].[ProductID]>(3)">
<Logical Operation="OR">
<ScalarOperator>
<Compare CompareOp="LT">
<ScalarOperator>
<Identifier>
<ColumnReference Database="[AdventureWorks2022]" Schema=
"[Production]" Table="[Product]" Column="ProductID">
</ColumnReference>
</Identifier>
</ScalarOperator>
<ScalarOperator>
<Const ConstValue="(3)">
</Const>
</ScalarOperator>
</Compare>
</ScalarOperator>
<ScalarOperator>
<Compare CompareOp="GT">
<ScalarOperator>
<Identifier>
<ColumnReference Database="[AdventureWorks2022]" Schema="[Production]" Table="[Product]" Column="ProductID">
</ColumnReference>
</Identifier>
</ScalarOperator>
<ScalarOperator>
<Const ConstValue="(3)">
</Const>
</ScalarOperator>
</Compare>
</ScalarOperator>
</Logical>
</ScalarOperator>
now first it defines where does this scalar exist
after that it includes the following:
- one logical or
- one logical identifier that looks for the rows in the table
- one scalar gt meaning greater than, here 3
- one scalar lt meaning less than , here 3
- one scalar constant meaning 3
- so it identifies the rows that is greater or less than the constant 3
- then it ends
  <ParameterList>
              <ColumnReference Column="@1"
              ParameterDataType="tinyint"
               ParameterCompiledValue="(3)"
               ParameterRuntimeValue="(3)">
              </ColumnReference>
            </ParameterList>
now here since we have to pass a parameter to the operator scalar, the one that we saw as scalar(3) in the graphical it has to create a worktable for it ( a table that only exists internally), and in order to do that it has to define the data type used in there tinyint, then it has to name the parameter which is @1, then in it has to pass the value, and since there is no actual database for that it ends there
and here the XML execution plan ends
Text plan
now we could query that by using the following:
SET SHOWPLAN_TEXT ON;
GO

SELECT ProductID
FROM Production.Product
where ProductID <> 3 ;

GO

SET SHOWPLAN_TEXT OFF;
GO
and the output would be two tables
one for the text of the statement itself and one for the execution plan
  |--Index Scan(OBJECT:
  ([AdventureWorks2022].[Production].[Product].[AK_Product_ProductNumber]),
  WHERE:([AdventureWorks2022].[Production].[Product].[ProductID]<(3) OR
  [AdventureWorks2022].[Production].[Product].[ProductID]>(3)))
so we have an index scan on the table defined with, the results could not be 3
or we could use:
SET SHOWPLAN_all ON;
GO

SELECT ProductID
FROM Production.Product
where ProductID <> 3 ;

GO

SET SHOWPLAN_all OFF;
GO
and the output would be:

or we could use:
SET statistics profile ON;
GO

SELECT ProductID
FROM Production.Product
where ProductID <> 3 ;

GO

SET statistics profile Off;
GO
and the output would be like:

manually moving the estimated rows near the actual rows provides an easy way of comparing actual vs estimated rows, to look for cardinality estimator errors.
Warnings in Execution plans
ColumnWithNoStatistics
the query optimizer did not find any statistics on the column in question
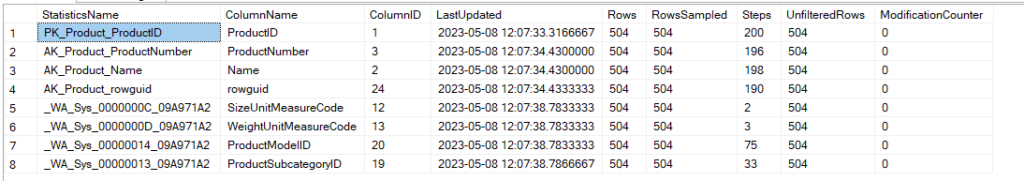
first let’s find the statistics on the column
SELECT
    s.name AS StatisticsName,
    c.name AS ColumnName,
    c.column_id AS ColumnID,
    sp.last_updated AS LastUpdated,
    sp.rows AS Rows,
    sp.rows_sampled AS RowsSampled,
    sp.steps AS Steps,
    sp.unfiltered_rows AS UnfilteredRows,
    sp.modification_counter AS ModificationCounter
FROM
    sys.stats AS s
    JOIN sys.stats_columns AS sc ON s.object_id = sc.object_id AND s.stats_id = sc.stats_id
    JOIN sys.columns AS c ON sc.object_id = c.object_id AND sc.column_id = c.column_id
    CROSS APPLY sys.dm_db_stats_properties(s.object_id, s.stats_id) AS sp
WHERE
    s.object_id = OBJECT_ID('Production.Product');
and the following output:
now let’s drop productmodelid stats
DROP STATISTICS Production.Product._WA_Sys_00000014_09A971A2;
and turn off auto stats creation
ALTER DATABASE AdventureWorks2022
  SET AUTO_CREATE_STATISTICS OFF,
      AUTO_UPDATE_STATISTICS OFF,
      AUTO_UPDATE_STATISTICS_ASYNC OFF;
now let’s select ProductModelID:
SELECT ProductModelID
From Production.Product
WHERE Product.ProductModelID<>2
And the execution plan would be
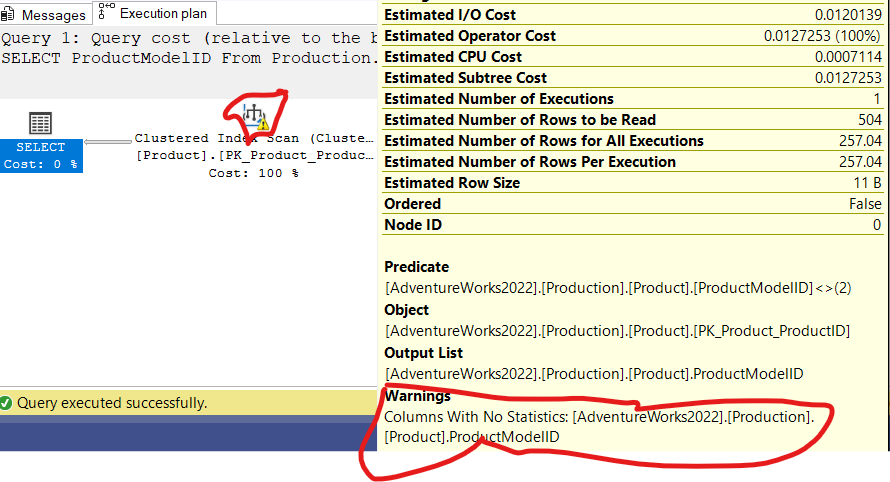
as you can see there are no stats on the column
now let’s clean up:
ALTER DATABASE AdventureWorks2022
  SET AUTO_CREATE_STATISTICS ON,
      AUTO_UPDATE_STATISTICS ON,
      AUTO_UPDATE_STATISTICS_ASYNC ON;
and the execution plan would have no warning since SQL server would create stats if there are not any
NoJoinPredicate
now if we use the old joining method like
SELECT*
FROM Production.Product, Production.ProductSubcategory
WHERE Product.ProductSubcategoryID =ProductSubcategory.ProductSubcategoryID
You would get the following:
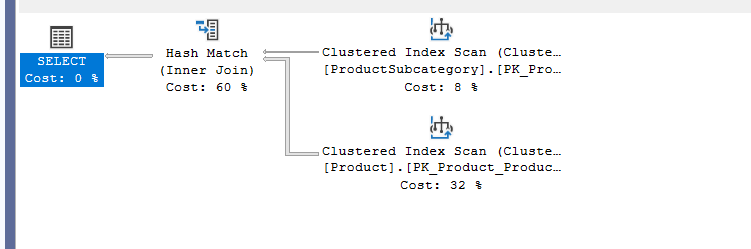
now if we delete the where clause:
SELECT*
FROM Production.Product, Production.ProductSubcategory
we would get:
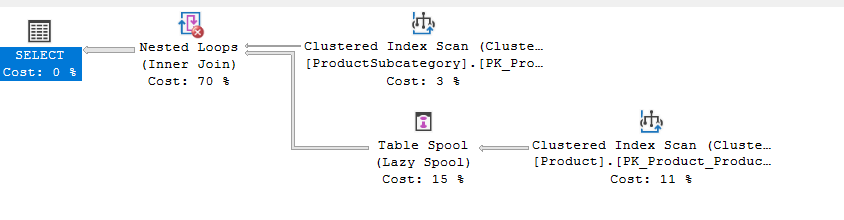
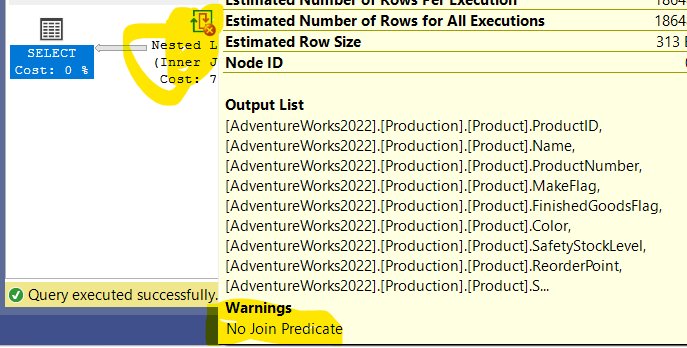
since there is no join predicate
or we could use a cross join:
SELECT*
FROM Production.Product cross join Production.ProductSubcategory
and we would get the same warning
PlanAffectingConvert:
it shows where conversions may impact cardinality estimation
for example nvarchar to varchar like:
DECLARE @PASSWORDHASHV NVARCHAR(200)
SET @PASSWORDHASHV = 'pbFwXWE99vobT6g+vPWFy93NtUU/orrIWafF01hccfM='

SELECT*
FROM Person.Password
WHERE PasswordHash=@PASSWORDHASHV
in the execution plan:
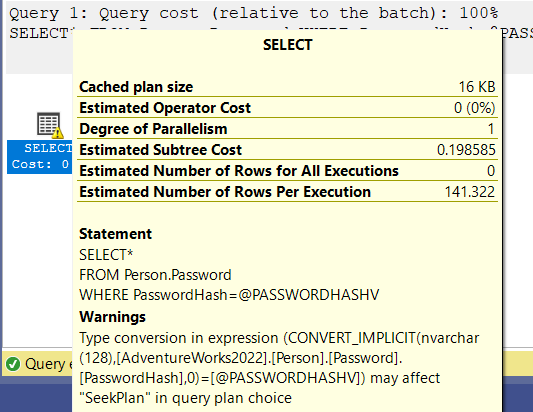
if we declare it as varchar or cast or convert it beforehand we would not have this problem
why does it?
it makes the predicate non-sargable
meaning can’t be seeked
more on that in another blog
UnmatchedIndexes
it shows up when the query optimizer can’t see the value that requested the filtered index
for example,
let’s create a filtered index:
create index IX_FirstName on Person.Person(PersonType,NameStyle)
where Firstname = 'Ken'
now let’s declare a variable that requests the data:
DECLARE @FirstName NVARCHAR(50);
SET @FirstName = 'Ken';
SELECT PersonType, NameStyle
FROM Person.Person
WHERE FirstName = @FirstName;
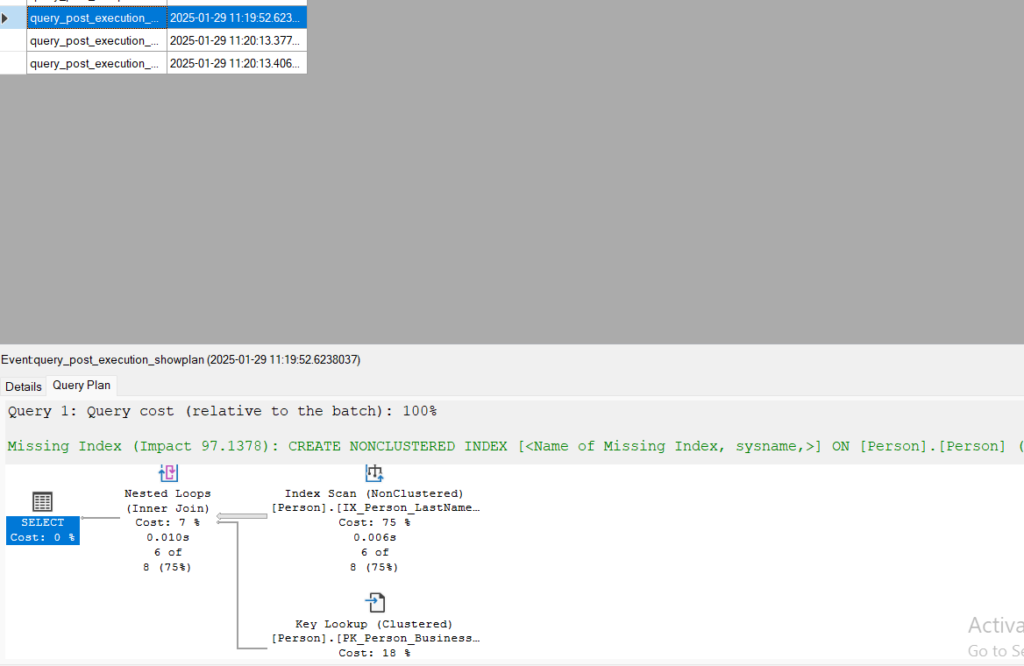
And the output would be:
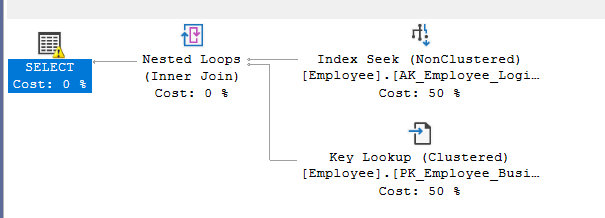
as you can see we have a warning, if we hover over it, it would not show us anything related to the warning.
however in the graphical plan:

or in the XML:
<UnmatchedIndexes>
             <Parameterization>
                <Object Database="[AdventureWorks2022]"
                Schema="[Person]" Table="[Person]" Index="[IX_FirstName]" />
              </Parameterization>
            </UnmatchedIndexes>
            <Warnings UnmatchedIndexes="true" />
now if we did not declare a variable and asked for the value directly like:
SELECT PersonType, NameStyle
FROM Person.Person
WHERE FirstName = 'Ken';
the plan would be like:
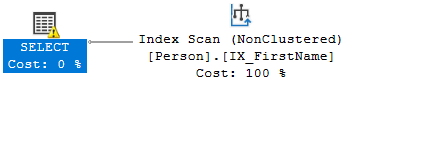
it matched but the error still shows up,(DBA Exchange)
if we look inside the index scan properties we can see this:
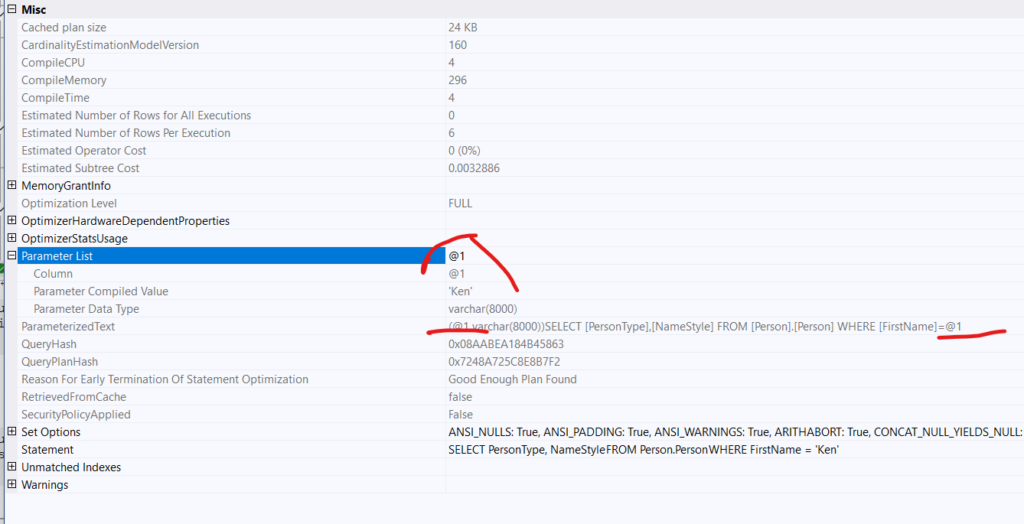
as you can see SQL server parameterized the query, so it did something similar to what we did, so the indexes did not match according to the warning ,
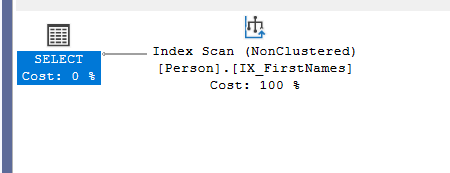
now if we look into the properties of the index scan, that looks like it is scanning the index and the warning coming out of nowhere:
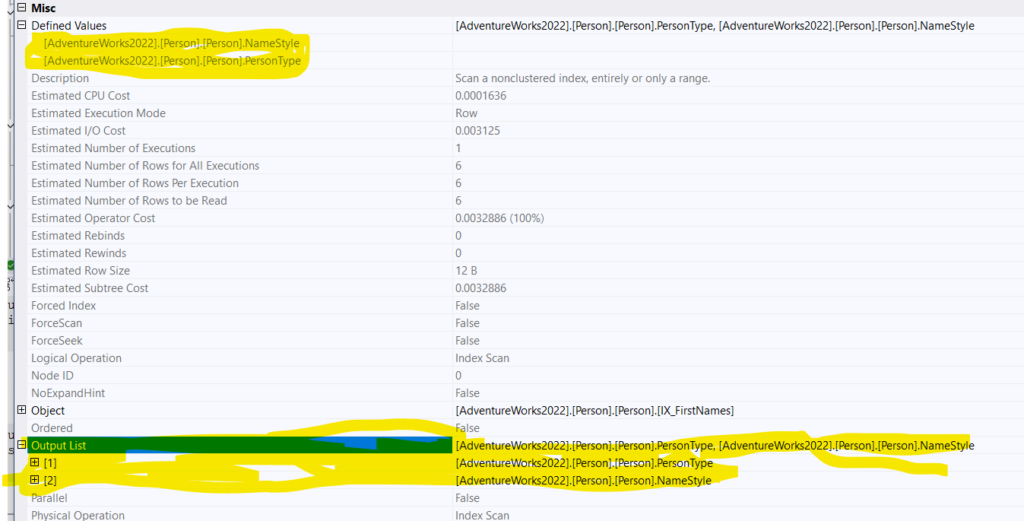
we can see it is using it is defining the other two indexes ,
now if we use trace flags 7352 and 3604 to see the final plan of this query(more on that in the previous blog the query optimizer):
We can see the following output
Index Scan Index Scan (0)

                    [QCOL: [AdventureWorks2022].[Person].[Person].PersonType TI(nchar collate 872468488,Trim,ML=4)] 000002368D5EF500  P

                    [QCOL: [AdventureWorks2022].[Person].[Person].NameStyle TI(bit,ML=1)] 000002368D5EF660  P
so this was the output
how could get around that
by making the query a non-candidate for simple parameterization
how?
by adding a subquery like suggested:
SELECT PersonType, NameStyle
FROM Person.Person
WHERE FirstName = 'Ken'
and  1 = (select 1 );
now if we run the traces, we see the same output, the same two index scans we had before
meaning if it did use it in here then i must have used it there. since the queryplans show no difference when we use the use plan hint
but if we drop the index and run it again we can see in the final query tree:
*** Output Tree: ***

        PhyOp_Apply lookup TBL: Person.Person (0) (x_jtInner)

            PhyOp_Filter

                PhyOp_Range TBL: Person.Person(2) ASC  Bmk ( QCOL: [AdventureWorks2022].[Person].[Person].BusinessEntityID) IsRow: COL: IsBaseRow1000

                ScaOp_Comp x_cmpEq

                    ScaOp_Identifier QCOL: [AdventureWorks2022].[Person].[Person].FirstName

                    ScaOp_Const TI(nvarchar collate 872468488,Var,Trim,ML=6) XVAR(nvarchar,Owned,Value=Len,Data = (6,75101110))

            PhyOp_RestrRemap

                PhyOp_Range TBL: Person.Person(1) ASC  Bmk ( QCOL: [AdventureWorks2022].[Person].[Person].BusinessEntityID) IsRow: COL: IsBaseRow1000  Fetch

                    ScaOp_Comp x_cmpIs

                        ScaOp_Identifier QCOL: [AdventureWorks2022].[Person].[Person].BusinessEntityID

                        ScaOp_Identifier QCOL: [AdventureWorks2022].[Person].[Person].BusinessEntityID

********************
if it is not using it, we are supposed to see this, if it is using it, we are not supposed to see this.
SET STATISTICS TIME and IO statements
The first one would show us how long did it take the optimizer to optimize the query, and how long did it take to finish running the query.
it would show us the actual cost not the estimated one, since the first one is estimated by the optimizer.
we can see the same information in the execution plan, but since this is a cheaper way to get the same information we could use it so we don’t have to get the actual execution plan completely.
example:
set statistics time on
SELECT SalesOrderDetailID
FROM Sales.SalesOrderDetail
and we would get:
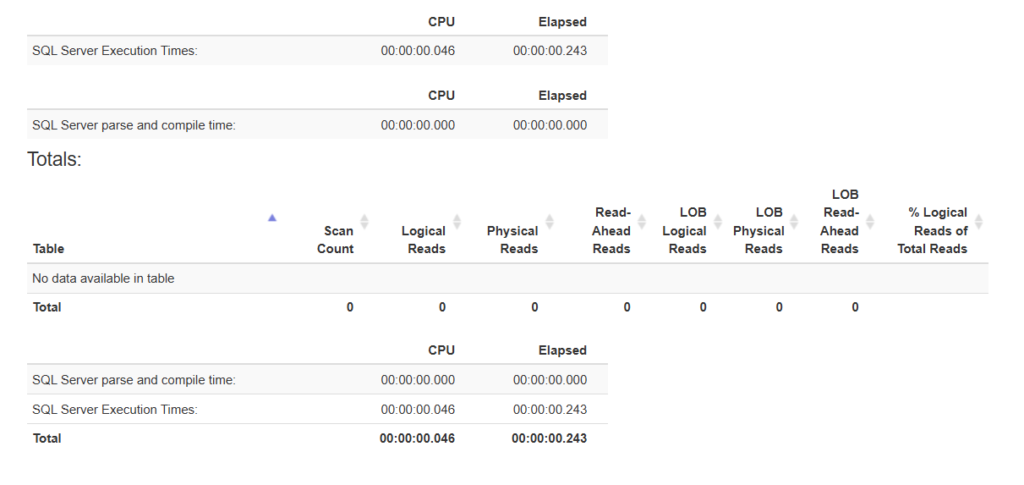
 SQL Server Execution Times:
   CPU time = 46 ms,  elapsed time = 243 ms.
SQL Server parse and compile time:
   CPU time = 0 ms, elapsed time = 0 ms.
so in order to generate the plan = parse and compile
and for the actual execution time = 243 ms
now we could parse it through this website, to make it more readable and comparable.
if we put our output in there we would get:
now we could turn off the stats:
SET STATISTICS TIME OFF
If we don’t do that, it will keep on generating the same information for every query we run
and the other statement is, statistics io, which shows us the other results in the output of the website
to get a sense of what the query would cost if we did not have the information in memory we have to clean the buffers
for example:
DBCC DROPCLEANBUFFERS
After that:
SET STATISTICS IO ON;
SELECT SalesOrderDetailID
FROM Sales.SalesOrderDetail
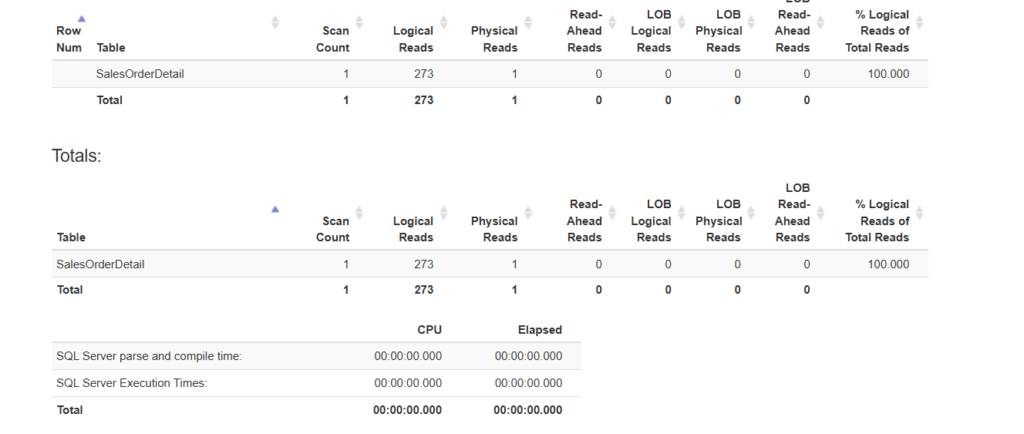
and the output would be:
Table 'SalesOrderDetail'. Scan count 1,
logical reads 273,
physical reads 1,
page server reads 0,
read-ahead reads 271,
page server read-ahead reads 0,
lob logical reads 0,
lob physical reads 0,
lob page server reads 0,
 lob read-ahead reads 0,
 lob page server read-ahead reads 0.
logical reads = number of reads from the buffers= memory
physical reads = number of reads from disk for example SSD
read ahead reads = it exactly as it sounds, how many pages did SQL server read ahead from physical storage even though we did not need it for the certain query but, it anticipates that we might need it in the future
LOB = large object
the page server = Non-zero for Azure SQL Database Hyperscale only.
and on the website we can see:
now set it off
SET STATISTICS IO OFF;
Extended events:
we already introduced it here
we can run the following extended events for query plans:
CREATE EVENT SESSION [query_plan] ON SERVER
ADD EVENT sqlserver.query_post_compilation_showplan,
ADD EVENT sqlserver.query_post_execution_showplan,
ADD EVENT sqlserver.query_post_execution_stats,
ADD EVENT sqlserver.query_pre_execution_showplan(
    WHERE ([database_name]=N'AdventureWorks2022'))
ADD TARGET package0.event_file(SET filename=N'query_plan',max_file_size=(200))
WITH (MAX_MEMORY=4096 KB,
EVENT_RETENTION_MODE=ALLOW_SINGLE_EVENT_LOSS,
MAX_DISPATCH_LATENCY=30 SECONDS,MAX_EVENT_SIZE=0 KB,MEMORY_PARTITION_MODE=NONE,
STARTUP_STATE=ON)
we can see in the live data session after we click on our query
now we have the plan.
we can stop the session now.
DMVs And DMFs
we already explained them in another blog, the same methods used there, are used here, since blocking is a query performance issue.
See you in the next blog.