Hi everyone, today we are going to explore how to use wait stats to see the top system slowing problems, we are going to focus on locking and blocking-related ones, and after that, we are going to dig deeper into some DMVs related to locking, afterward, we are going to explore some extended events sessions, and see some ways of maintaining information related to concurrency in the long run while troubleshooting
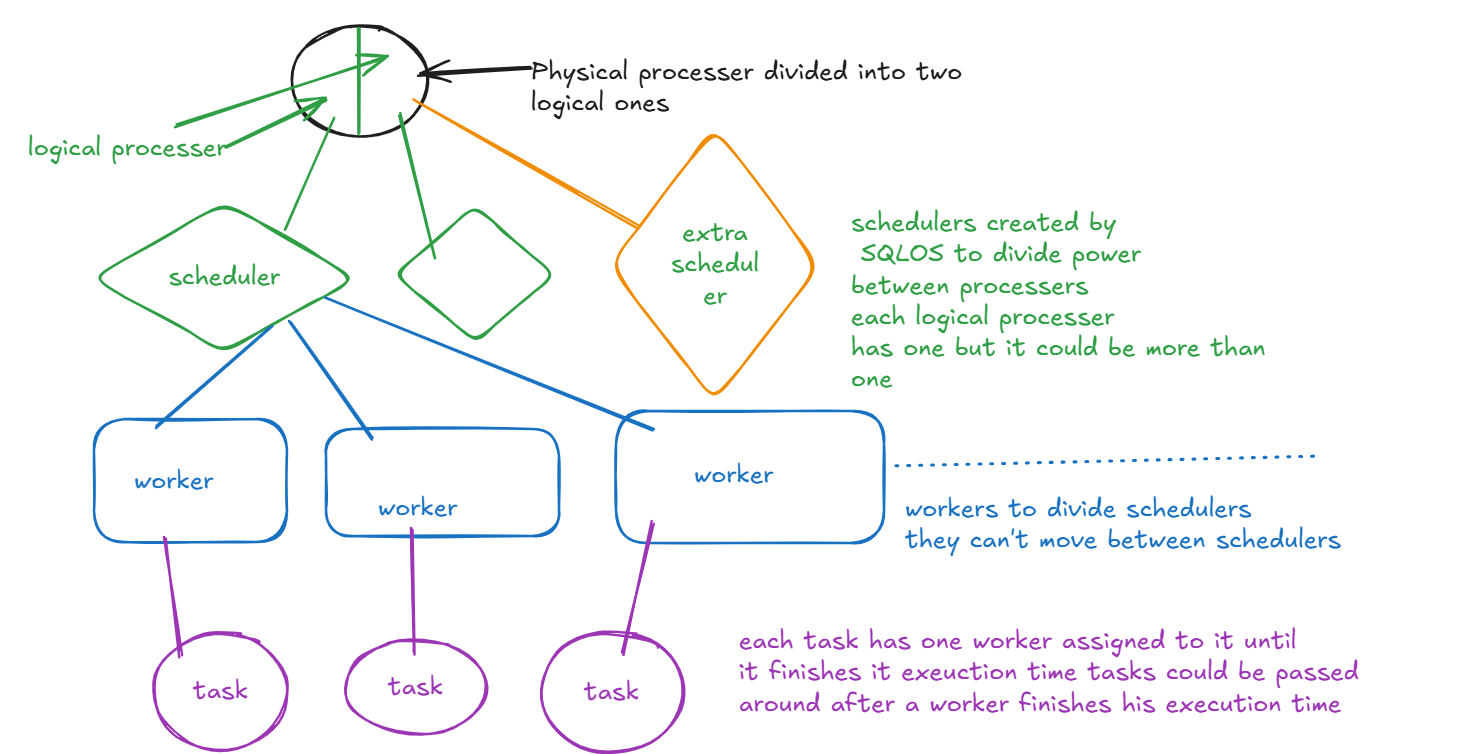 now let’s get back to workers
workers have 6 states:
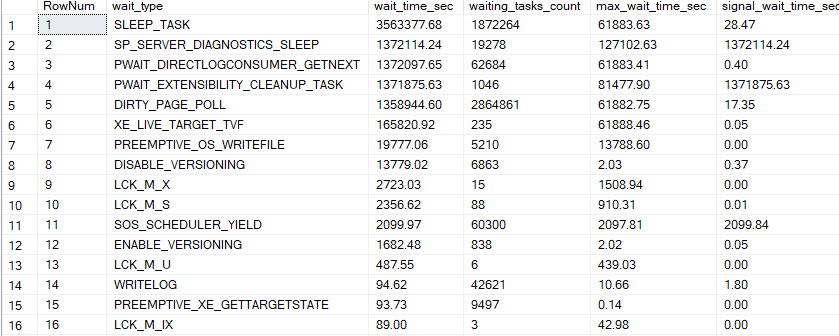 and it goes on
 our LCK_M_U is at the top of the list and there are like 400 tasks waiting on it
which queries are they
you can run sp_WhoIsActive to find the current ones
 as you can see our query is blocking the others and they are blocking each other
 now you got your text
next you need the plan and you would have:
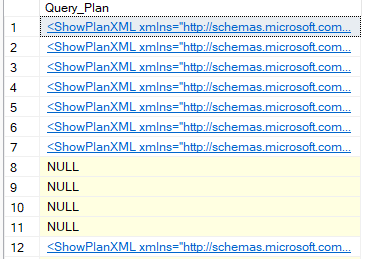 obviously not all plans are cached that is what you need query store or some monitoring tool for
you click on it to analyze and this is the subject of another topic
and there are the other stuff like worker_time for CPU consumption, logical reads for memory and physical reads for disk, how many times did this query get executed and stuff like that should be valued with our wait_stats to see if this is the query causing the problem
 now we have a select test query I ran with SQlStress, now we could click on the plan and this
 now this is a stored procedure that could not be tuned more
the query text is

 read_write means it both stores query plans and you can read it from them if it was read_only it would not be recording but you could reach the recorded information
auto: means it does not capture all the queries just the resource-intensive ones it could be NONE or ALL meaning it has no inner filter
flush_interval_seconds: every 900 seconds our queries will be flushed to disk unlike sys.dm_exec_query_stats which only has memory stuff
max_plan_per_query: exactly as it sounds like
max_storage_size_mb: the size of the query store
stale_query_threshold_days: if a query is not re-executed in 30 days it will be deleted
size_based_cleanup_mode_desc: auto means it would delete the older stale rarely used query plans if the storage is full, we have to configure this based on our workload sometimes we need more gigs sometimes we don’t
wait_stats_capture_mode_desc: would store the waits stats in the query store
now we ourselves have to correlate the top resource-consuming queries with wait_stats if we find anything then that’s it, but if we do not then we have to run extended events over some periods, and if not then over longer periods maybe on the wholes instance or maybe on a specific session and all of these moves depend on our previous findings
we can configure query store
like
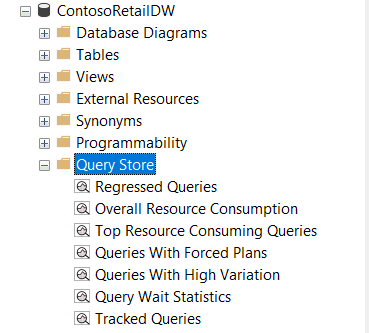 click on the top resource-consuming queries
you could run the following stored procedure 100 times in batch mode after you click
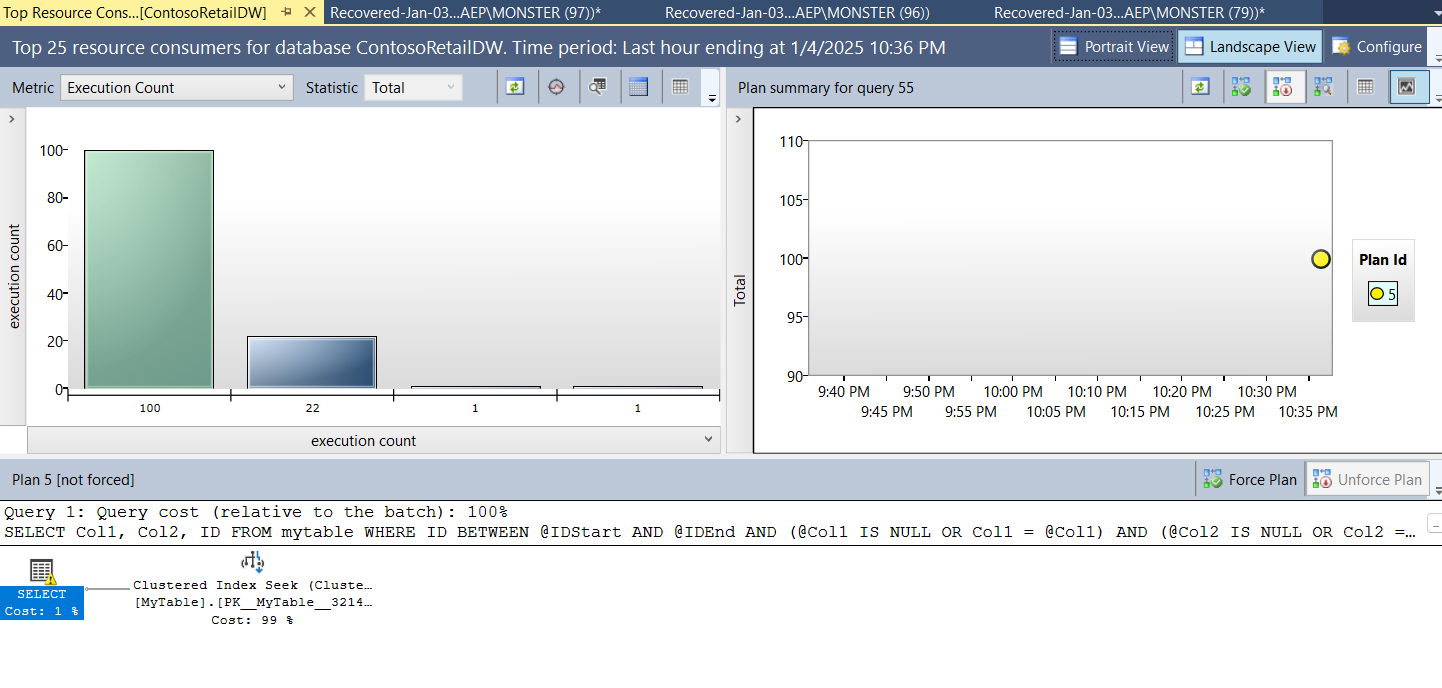 you can see the query plan that we had before
and you can see the text in the query plan or you can hover over the green diagram and it would show it to you
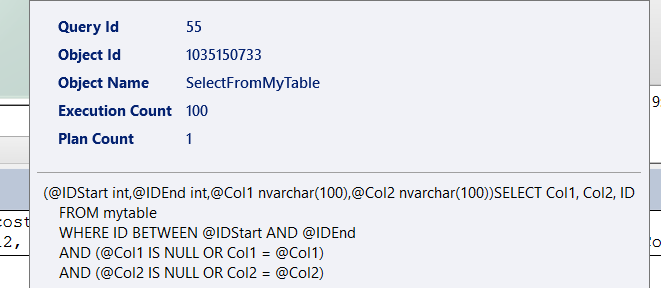 and this is one of the main usage cases of the query store
And in wait_stats we can see the wait categories that caused by certain queries and to do that we should click on the wait stats in query store and this would pop up for example
 now how could we correlate that with locks:
 we could filter database locks if we want and show the others
 it is the same query and since it executed so fast we could not find the plans but we would find them in the sys.dm_exec_query_stats or query store or extended events or anything we used instead of this real-time stuff
 it is the same stored procedure we used before with the same text
now here we did not have any wait since there is no blocking now if we run an update statement on the same table and then try to run this we would get:
 now it is waiting on the row we are updating and this is how would correlate it
in sp_whoisactive
 you could see the session that is blocking the one that is updating in our case
it would show the wait_type here we are trying to read so it is LCK_M_S
now if we rollback our update everything would go just smoothly
 back to LCK_M_U waits
As we said if we had update statements that is in suspended state it would generate this kind of wait
now when would this happen
 in the properties we can see the seek operation

 now here we can see the scan if it had just seeked the row the collision would never have happened
but since It had to scan the table to see it got blocked.
let’s start troubleshooting:
 here it was the top wait os it is worth looking into
 so first the session id’s and their text we can see that if we are blocked in real-time if we click on them we will see our queries and immediately realize that our problem in some index then we can either kill or roll back or wait commit depending
 here we can see our U wait not the X since U is not compatible with X lock even though it is just scanning to get to another but since no index = wait for no reason
 here we can see that the first transaction I just sleeping not running or waiting on another resource so here we are missing a commit
the other one could be nested or we are missing a rollback or a commit
 here we can see the timestamp information

 here we can see our WAIT the query text, and the table, and the execution plan

 if the session was not blocking in real-time this is the first place to look in, here we can see similar information
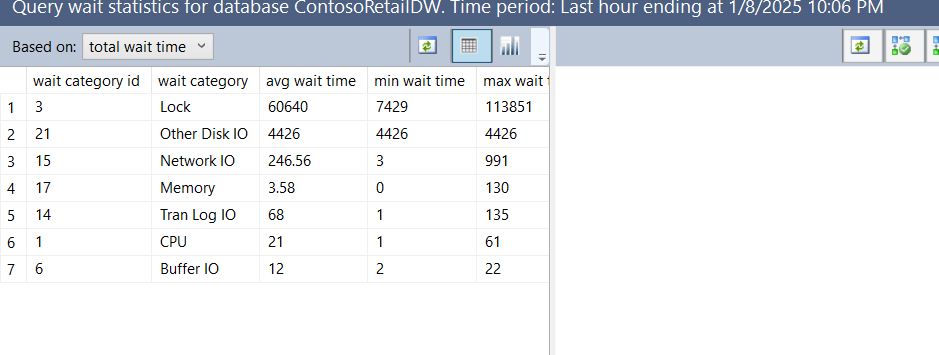 here we can see the top wait was lock wait in the last hour and if we click on the chart we can pinpoint which queries has been blocked in the last hour
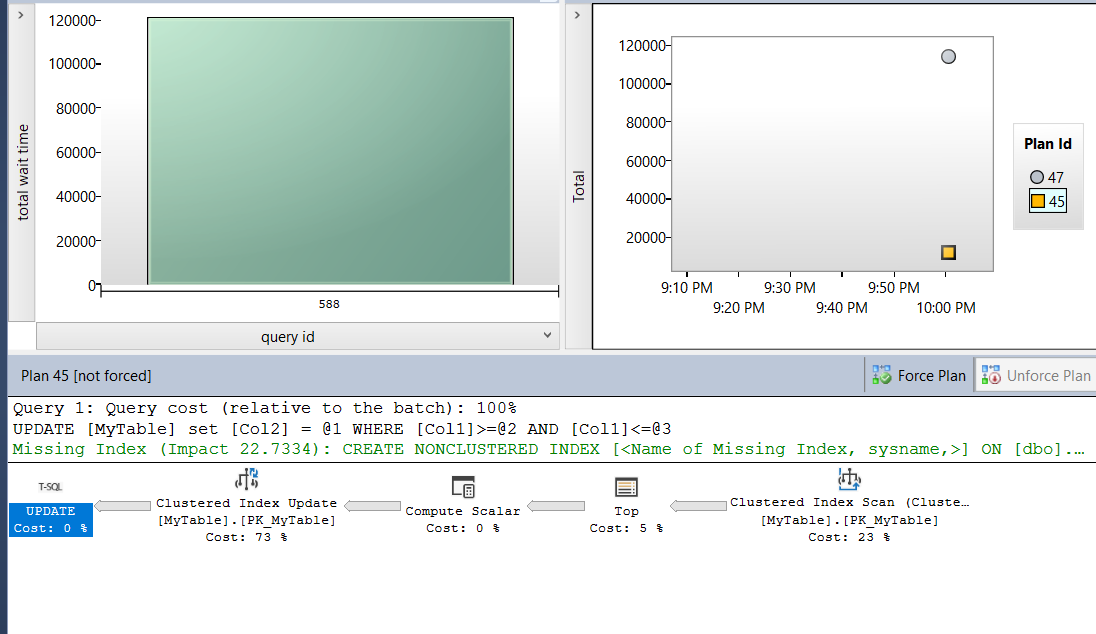 this is stored on disk so whenever we want it we can get it
 here we can identify which session was blocking etc. same old stuff in the other DMVs but in an event_file so we could get back to it whenever we wanted it also shows it is an U lock that we want and that an X lock is blocking it and the plans involved and as a suggestion it said we need to stop the sleeping query
now let’s rollback the transaction and create and index on Col1 and include Col2 so it could reach right to it and never collide
 and no blocking
Expert SQL Server Transactions and Locking: Concurrency Internals for SQL Server Practitioners by Dmitri Korotkevitch Pro SQL Server Internals by Dmitri Korotkevitch SQL Server Advanced Troubleshooting and Performance Tuning: Best Practices and Technique by Dmitri Korotkevitch SQL Server Concurrency by Kalen Delaney Microsoft SQL Server 2012 Internals by Kalen Delaney
The setup for this blog
Here we created a table that has ID columns incrementing from one, two other columns Col1 and Col2 varchar(100) each, PK on ID and clustered index on it then we inserted 100 000 rowsUSE ContosoRetailDW;
-- Drop the table if it exists
DROP TABLE IF EXISTS MyTable;
-- Create the table with an ID column, Col1, and Col2, naming the primary key constraint near the ID
CREATE TABLE MyTable (
ID INT CONSTRAINT PK_MyTable PRIMARY KEY CLUSTERED,
Col1 VARCHAR(100),
Col2 VARCHAR(100)
);
-- Insert 100,000 rows incrementally
INSERT INTO MyTable (ID, Col1, Col2)
SELECT
ROW_NUMBER() OVER (ORDER BY (SELECT NULL)) AS ID,
'C1' + CAST(ROW_NUMBER() OVER (ORDER BY (SELECT NULL)) AS VARCHAR),
'C2' + CAST(ROW_NUMBER() OVER (ORDER BY (SELECT NULL)) AS VARCHAR)
FROM
(SELECT TOP (100000) 1 AS placeholder
FROM sys.objects AS so1
CROSS JOIN sys.objects AS so2
CROSS JOIN sys.objects AS so3
CROSS JOIN sys.objects AS so4) AS derived;
Wait Statistics
so we have a CPU in our system, each OS deals with dividing work between processors differently SQLOS is the way that our engine deals with that how does it do that? it first creates a scheduler scheduler is a piece of software that uses the actual CPU okay, how many schedulers does my system have? One for each logical processer plus one for your DAC what is a logical processor? is a piece of software that is created by the vendor(intel etc.) to divide your physical processor what is a physical processor? is your CPU core= hardware in my system, i have 12700h i7 this has 6 performance cores, each has 2 logical cores meaning 12 logical processor plus it has 8 efficient cores with one logical processer each so I have 20 logical processors so i have 21 schedulers They are online schedulers plus one for DAC and there are hidden schedulers that are created to deal with internal processes One CPU can have more than one scheduler this is a DMV to show you the schedulers in your systemSELECT
scheduler_id,
cpu_id,
status,
is_online,
is_idle,
preemptive_switches_count
FROM
sys.dm_os_schedulers;
 now let’s get back to workers
workers have 6 states:
- pending: the task is waiting for an available worker
- done: it is done
- running: executing
- runnable: the task is waiting for a scheduler
- suspended: task is waiting for something other than the CPU itself like memory or I/O request
- spinloop: something internal to protect the engine, it happens when you know you will access the table fairly quickly like right away instead of being passed around between workers
WITH WaitStats AS (
    SELECT
        ROW_NUMBER() OVER (ORDER BY wait_time_ms DESC, waiting_tasks_count DESC) AS RowNum,
        wait_type,
        CAST(wait_time_ms / 1000.0 AS DECIMAL(18, 2)) AS wait_time_sec,
        waiting_tasks_count,
        CAST(max_wait_time_ms / 1000.0 AS DECIMAL(18, 2)) AS max_wait_time_sec,
        CAST(signal_wait_time_ms / 1000.0 AS DECIMAL(18, 2)) AS signal_wait_time_sec
    FROM
        sys.dm_os_wait_stats
    WHERE
        wait_type NOT IN (
            'BROKER_EVENTHANDLER', 'BROKER_RECEIVE_WAITFOR', 'BROKER_TASK_STOP', 'BROKER_TO_FLUSH',
            'BROKER_TRANSMITTER', 'CHECKPOINT_QUEUE', 'CHKPT', 'CLR_AUTO_EVENT',
            'CLR_MANUAL_EVENT', 'CLR_SEMAPHORE', 'DISPATCHER_QUEUE_SEMAPHORE',
            'FT_IFTS_SCHEDULER_IDLE_WAIT', 'FT_IFTSHC_MUTEX', 'HADR_CLUSAPI_CALL',
            'HADR_FILESTREAM_IOMGR_IOCOMPLETION', 'HADR_LOGCAPTURE_WAIT', 'HADR_NOTIFICATION_DEQUEUE',
            'HADR_TIMER_TASK', 'HADR_WORK_QUEUE', 'LAZYWRITER_SLEEP', 'LOGMGR_QUEUE',
            'ONDEMAND_TASK_QUEUE', 'PWAIT_ALL_COMPONENTS_INITIALIZED',
            'QDS_PERSIST_TASK_MAIN_LOOP_SLEEP', 'QDS_ASYNC_QUEUE', 'QDS_CLEANUP_STALE_QUERIES_TASK',
            'REQUEST_FOR_DEADLOCK_SEARCH', 'RESOURCE_QUEUE', 'SERVER_IDLE_CHECK',
            'SOS_WORK_DISPATCHER', 'SQLTRACE_INCREMENTAL_FLUSH_SLEEP', 'SQLTRACE_WAIT_ENTRIES',
            'VDI_CLIENT_OTHER', 'WAIT_FOR_RESULTS', 'WAITFOR', 'WAITFOR_TASKSHUTDOWN',
            'WAIT_XTP_RECOVERY', 'XE_DISPATCHER_JOIN', 'XE_DISPATCHER_WAIT', 'XE_TIMER_EVENT'
        )
)
SELECT
    RowNum,
    wait_type,
    wait_time_sec,
    waiting_tasks_count,
    max_wait_time_sec,
    signal_wait_time_sec
FROM
    WaitStats
ORDER BY
    RowNum;
 and it goes on
- analyzing top waits
- then proving it with PerfMon and DMVs
- then running extended events to find the root of the problem
- then fixing it
Lock waits=LCK_M_
each lock has its wait type for example LCK_M_U is for U locks etc. locks could be by 10000000 queries or there could be a couple of them in each result, you will have a different approach to tuning them wait stats gets updated with every restart of the server and you should have a representative workload if you think your wait stats are polluted you should use DBCC SQLPERF(’sys.dm_os_wait_stats’, CLEAR) and start over from thereLCK_M_U
it should be correlated with PAGEIOLATCH if you need to read from disks too many times to get the queries executed also if you update a lot of stuff you might hit the parallisim threshold for your queries at that moment you might see CXPACKET waits okay, how could we catch those queries that are the most resource-intensive after we know we have a blocking scenario? extended events and sys.dm_exec_query_stats the problem with both is they are based on cache so unless you store your extended events, DMVs and extended events will only catch real-time stuff so is that a problem? if you have a report that happens on a monthly basis and blocks everybody yes other than that, no why? because our target is generally speaking the most executed and resource-intensive queries. and these are generally cached we could also use query store to store the plans and only the plans to determine which one is blocking the others there is no specific counters in the query store for those so you have to run extended events for those also, some transactions might not be committed due to poor practices we should keep that in mind let’s see this wait type in action first, we are going to clear wait stats first, we are going to select a from our MyTable then never commit then we will use SQLQueryStress, Adam Machanic’s tool to update one row 2000 times then we will look up our wait stats soDBCC SQLPERF('sys.dm_os_wait_stats', CLEAR);
USE ContosoRetailDW;
GO
BEGIN TRAN;
SELECT Col1, Col2
FROM MyTable WITH (serializable);
USE ContosoRetailDW;
begin tran
UPDATE MyTable
SET Col2 = 'whatever'
WHERE Col1 = 'C11';
rollback
 our LCK_M_U is at the top of the list and there are like 400 tasks waiting on it
which queries are they
you can run sp_WhoIsActive to find the current ones
 as you can see our query is blocking the others and they are blocking each other
what about sys.dm_exec_query_stats we could use that to see the cached plans not just the active ones how could we do that?
it is a DMV that has a lot of columns but the most important ones for our use today:- statement_start_offset and statement_end_offset: both give when did the query text start in terms of bytes and when does it end, if end_offset is -1 then it does not contain a value and you could just use start_offset. you can use these values and CROSS APPLY them with sys.dm_exec_sql_text() function to get the query text, and since they are in bytes we have to divide by 2, and since SQL server uses 1-based indexing we have to add one and this would look like this:
SELECT
    SUBSTRING(qtext.text, (qstats.statement_start_offset / 2) + 1,
        ((CASE qstats.statement_end_offset
            WHEN -1 THEN DATALENGTH(qtext.text)
            ELSE qstats.statement_end_offset
         END - qstats.statement_start_offset) / 2) + 1) AS QueryText
FROM
    sys.dm_exec_query_stats qstats WITH (NOLOCK)
    CROSS APPLY sys.dm_exec_sql_text(qstats.sql_handle) qtext
SELECT Col1, Col2 FROM mytable WHERE ID BETWEEN 10 AND 20;
- sql_handle: A token that uniquely identifies the batch or stored procedure that the query is part of. in the docs he says meaning that length thing is a way of identifying where the statement in the transaction is could be at the end or the start the bytes tell you where and the token tell which transaction
SUBSTRING(qtext.text, (0 / 2) + 1, ((50 - 0) / 2) + 1) AS QueryText
--- meaning
SUBSTRING(qtext.text, 1, 26) AS QueryText
 now you got your text
next you need the plan and you would have:
- plan_handle: it is in our dmv you cross apply it with this function sys.dm_exec_query_plan() and you would get your plan from this function
SELECT
    qplan.query_plan AS Query_Plan
FROM
    sys.dm_exec_query_stats qstats WITH (NOLOCK)
    CROSS APPLY sys.dm_exec_query_plan(qstats.plan_handle) qplan;
 obviously not all plans are cached that is what you need query store or some monitoring tool for
you click on it to analyze and this is the subject of another topic
and there are the other stuff like worker_time for CPU consumption, logical reads for memory and physical reads for disk, how many times did this query get executed and stuff like that should be valued with our wait_stats to see if this is the query causing the problem
-- Query to get the top 50 queries with stats
SELECT TOP 50
    SUBSTRING(qtext.text, (qstats.statement_start_offset / 2) + 1,
        ((CASE qstats.statement_end_offset
            WHEN -1 THEN DATALENGTH(qtext.text)
            ELSE qstats.statement_end_offset
         END - qstats.statement_start_offset) / 2) + 1) AS Query_Text,
    qplan.query_plan AS Query_Plan,
    qstats.execution_count AS Exec_Count,
    (qstats.total_logical_reads + qstats.total_logical_writes) / qstats.execution_count AS Avg_IO,
    qstats.total_logical_reads AS Total_Reads,
    qstats.last_logical_reads AS Last_Reads,
    qstats.total_logical_writes AS Total_Writes,
    qstats.last_logical_writes AS Last_Writes,
    qstats.total_worker_time AS Total_Worker_Time,
    qstats.last_worker_time AS Last_Worker_Time,
    CAST(qstats.total_elapsed_time AS FLOAT) / 1000 AS Total_Elapsed_Time_Sec,
    CAST(qstats.last_elapsed_time AS FLOAT) / 1000 AS Last_Elapsed_Time_Sec,
    qstats.creation_time AS Cached_Time,
    qstats.last_execution_time AS Last_Exec_Time,
    qstats.total_rows AS Total_Rows,
    qstats.last_rows AS Last_Rows,
    qstats.min_rows AS Min_Rows,
    qstats.max_rows AS Max_Rows
FROM
    sys.dm_exec_query_stats qstats WITH (NOLOCK)
    CROSS APPLY sys.dm_exec_sql_text(qstats.sql_handle) qtext
    CROSS APPLY sys.dm_exec_query_plan(qstats.plan_handle) qplan
 now this is a stored procedure that could not be tuned more
the query text is
SELECT Col1, Col2, ID
FROM mytable
WHERE ID BETWEEN @IDStart AND @IDEnd
AND (@Col1 IS NULL OR Col1 = @Col1)
 AND (@Col2 IS NULL OR Col2 = @Col2)
Query Store
now how could we see the plans that are not in cache query store if persisted will have for us all our queries and their plans then we could correlate it with wait stats and see which one is causing the problem first we have to set it on :ALTER DATABASE [ContosoRetailDW]
SET QUERY_STORE = ON;
SELECT
    actual_state_desc,
    desired_state_desc,
    query_capture_mode_desc,
    flush_interval_seconds,
    interval_length_minutes,
    max_plans_per_query,
    max_storage_size_mb,
    stale_query_threshold_days,
    size_based_cleanup_mode_desc,
    wait_stats_capture_mode_desc
FROM
    sys.database_query_store_options;

 read_write means it both stores query plans and you can read it from them if it was read_only it would not be recording but you could reach the recorded information
auto: means it does not capture all the queries just the resource-intensive ones it could be NONE or ALL meaning it has no inner filter
flush_interval_seconds: every 900 seconds our queries will be flushed to disk unlike sys.dm_exec_query_stats which only has memory stuff
max_plan_per_query: exactly as it sounds like
max_storage_size_mb: the size of the query store
stale_query_threshold_days: if a query is not re-executed in 30 days it will be deleted
size_based_cleanup_mode_desc: auto means it would delete the older stale rarely used query plans if the storage is full, we have to configure this based on our workload sometimes we need more gigs sometimes we don’t
wait_stats_capture_mode_desc: would store the waits stats in the query store
now we ourselves have to correlate the top resource-consuming queries with wait_stats if we find anything then that’s it, but if we do not then we have to run extended events over some periods, and if not then over longer periods maybe on the wholes instance or maybe on a specific session and all of these moves depend on our previous findings
we can configure query store
like
ALTER DATABASE ContosoRetailDW
SET QUERY_STORE (
    OPERATION_MODE = READ_WRITE,
    QUERY_CAPTURE_MODE = AUTO,
    FLUSH_INTERVAL_SECONDS = 900,
    MAX_PLANS_PER_QUERY = 200,
    MAX_STORAGE_SIZE_MB = 1000,
    SIZE_BASED_CLEANUP_MODE = AUTO,
);
 click on the top resource-consuming queries
you could run the following stored procedure 100 times in batch mode after you click
CREATE PROCEDURE SelectFromMyTable
    @Col1Value VARCHAR(50),
    @Col2Value VARCHAR(50),
    @IDStart INT,
    @IDEnd INT
AS
BEGIN
    -- Select statement using parameters
    SELECT Col1, Col2
    FROM MyTable
    WHERE Col1 = @Col1Value
      AND Col2 = @Col2Value
      AND ID BETWEEN @IDStart AND @IDEnd;
END;
GO
EXEC SelectFromMyTable  @IDStart = 10, @IDEnd = 20;
GO 100
 you can see the query plan that we had before
and you can see the text in the query plan or you can hover over the green diagram and it would show it to you
 and this is one of the main usage cases of the query store
And in wait_stats we can see the wait categories that caused by certain queries and to do that we should click on the wait stats in query store and this would pop up for example
 now how could we correlate that with locks:
sys.dm_tran_locks, sys.dm_os_waiting_tasks, and sys.dm_exec_requests all show real-time information, for cached or stored data we need other dmvs= like sp_whoisactive
another way of correlating locks with query metadata is through joining these DMVs, now sys.dm_tran_locks might give you the session and the resource but it would not give you the query that is holding the locks, sys.dm_exec_requests would give the queries but not their locks, sys.dm_os_waiting_stats would give you detailed wait information on both, and to get the query text and plan you need sys.dm_exec_text(), and sys.dm_exec_query_plan() functions and by that you would get what kind of locks the queries are holding in real-time. here is a modified version ofSELECT
lcks.resource_type,
DB_NAME(lcks.resource_database_id) AS database_name,
CASE lcks.resource_type
WHEN 'OBJECT' THEN
OBJECT_NAME(lcks.resource_associated_entity_id, lcks.resource_database_id)
WHEN 'DATABASE' THEN 'DATABASE'
ELSE
CASE
WHEN lcks.resource_database_id = DB_ID() THEN
(SELECT OBJECT_NAME(object_id, lcks.resource_database_id)
FROM sys.partitions
WHERE hobt_id = lcks.resource_associated_entity_id)
ELSE '(Run under DB context)'
END
END AS object_name,
lcks.resource_description,
lcks.request_session_id,
lcks.request_mode,
lcks.request_status,
wt.wait_duration_ms,
qi.query_text,
qi.query_plan
FROM
sys.dm_tran_locks lcks WITH (NOLOCK)
LEFT OUTER JOIN
sys.dm_os_waiting_tasks wt WITH (NOLOCK)
ON lcks.lock_owner_address = wt.resource_address
AND lcks.request_status = 'WAIT'
OUTER APPLY
(
SELECT
SUBSTRING(
qtext.text,
(er.statement_start_offset / 2) + 1,
((CASE
WHEN er.statement_end_offset = -1 THEN DATALENGTH(qtext.text)
ELSE er.statement_end_offset
END - er.statement_start_offset) / 2) + 1
) AS query_text,
qplan.query_plan
FROM
sys.dm_exec_requests er WITH (NOLOCK)
CROSS APPLY
sys.dm_exec_sql_text(er.sql_handle) qtext
CROSS APPLY
sys.dm_exec_query_plan(er.plan_handle) qplan
WHERE
lcks.request_session_id = er.session_id
) qi
WHERE
lcks.request_session_id <> @@SPID
ORDER BY
lcks.request_session_id
OPTION (RECOMPILE);
 we could filter database locks if we want and show the others
 it is the same query and since it executed so fast we could not find the plans but we would find them in the sys.dm_exec_query_stats or query store or extended events or anything we used instead of this real-time stuff
 it is the same stored procedure we used before with the same text
now here we did not have any wait since there is no blocking now if we run an update statement on the same table and then try to run this we would get:
 you could see the session that is blocking the one that is updating in our case
it would show the wait_type here we are trying to read so it is LCK_M_S
now if we rollback our update everything would go just smoothly
Running Extended events
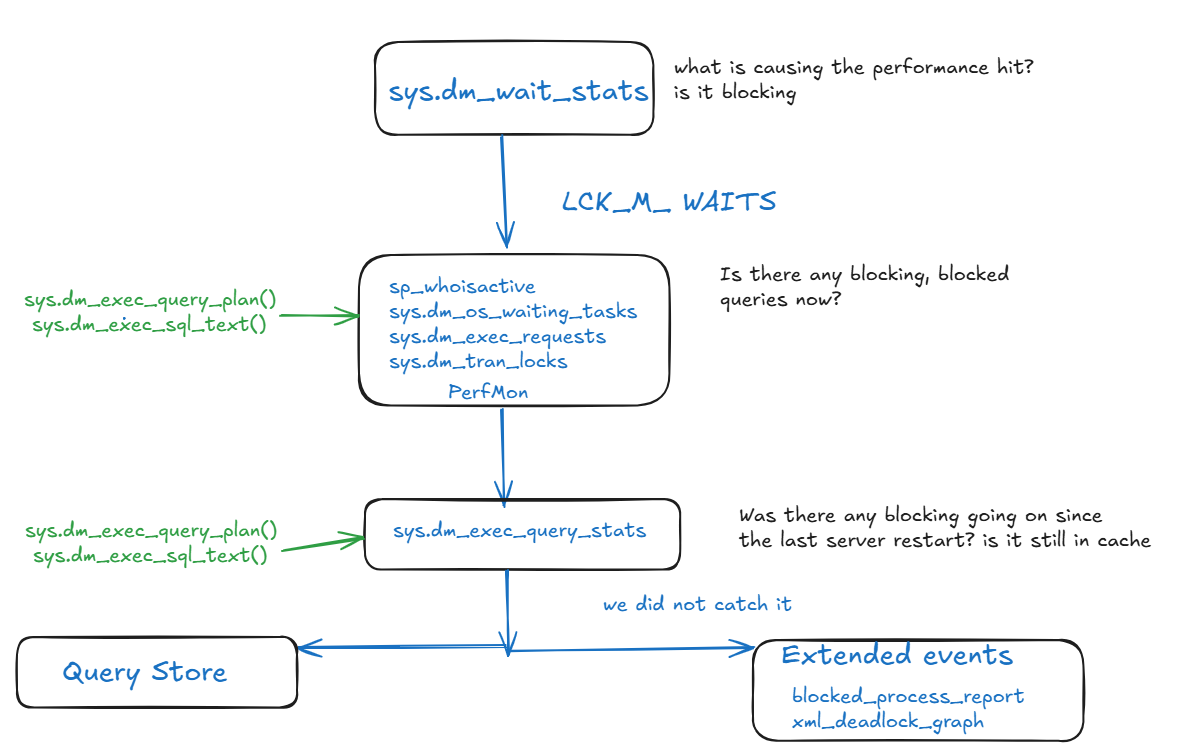
we already explored this in another blog (Extended events) feel free to check it out this a graphical presentation for troubleshooting blocking and deadlocking back to LCK_M_U waits
As we said if we had update statements that is in suspended state it would generate this kind of wait
now when would this happen
When it scans the index instead of seeking
if an update statement scans an index it would collide with any another X lock and wait until the statement ends this could increase this wait even if it tries to modify one row let’s take a look at one:- first, we will update some rows but never commit using the clustered index
- then in another session, we will try to update Col2 through Col1 and we will get blocked
- then we will start troubleshooting
BEGIN TRAN
UPDATE MyTable
SET Col1='New'
WHERE ID = 501
-- NEVER COMMIT
 in the properties we can see the seek operation
BEGIN TRAN
UPDATE MyTable
SET Col2 = 'NewValue'
WHERE Col1 BETWEEN 'C11' AND 'C1500';
 now here we can see the scan if it had just seeked the row the collision would never have happened
but since It had to scan the table to see it got blocked.
let’s start troubleshooting:
- wait_stats
- sp_WhoIsActive
 so first the session id’s and their text we can see that if we are blocked in real-time if we click on them we will see our queries and immediately realize that our problem in some index then we can either kill or roll back or wait commit depending
 here we can see our U wait not the X since U is not compatible with X lock even though it is just scanning to get to another but since no index = wait for no reason
 here we can see that the first transaction I just sleeping not running or waiting on another resource so here we are missing a commit
the other one could be nested or we are missing a rollback or a commit
 here we can see the timestamp information
- using sys.dm_tran_locks, sys.dm_os_waiting_tasks, and sys.dm_exec_requests all show real-time information

- sys.dm_exec_query_stats we could use that to see the cached plans not just the active ones how could we do that?
- Query Store
 here we can see the top wait was lock wait in the last hour and if we click on the chart we can pinpoint which queries has been blocked in the last hour
 this is stored on disk so whenever we want it we can get it
- blocked_process report with sp_HumanEventsBlockViewer
 here we can identify which session was blocking etc. same old stuff in the other DMVs but in an event_file so we could get back to it whenever we wanted it also shows it is an U lock that we want and that an X lock is blocking it and the plans involved and as a suggestion it said we need to stop the sleeping query
now let’s rollback the transaction and create and index on Col1 and include Col2 so it could reach right to it and never collide
CREATE NONCLUSTERED INDEX IX_MyTable_Col1
ON MyTable (Col1)
INCLUDE (Col2);
 and no blocking
LCK_M_S
it generates when there are queries that can’t select, like in the previous case when there is no index if the query in question was a SELECT instead of an UPDATE we could have seen this type of wait. as a solution, we could enable RCSI, but this does not solve the root cause which is a poorly optimized query. sometimes when an operation acquires a table lock we could see it too, like an online(not offline since this one acquires Sch-m and you would see LCK_M_Sch-S waits) index rebuild or a query hint that uses the TABLOCK let’s demonstrate the first case now this could only happen for some time since the online index rebuild has to acquire Sch-m locks at some pointLCK_M_X
happens mostly when you have an index and the engine knows exactly what rows it needs to update so instead of using U locks that it does not need, it directly acquires X locks if you try such statements while others are doing anything, you have to wait and your LCK_M_X waits will go up you might see the same kind of waits in update statements if you ran it against selects for example for example, if somebody has an S lock on the row you are updating you would acquire the U lock with no problem but once you find the row you want to update you have to convert it to an X lock and at that point, you have to waitLCK_M_SCH_S and LCK_M_SCH_M
Sch-m is incompatible with any other locks it requires all other users to shut down before starting so if we were doing anything and did some schema modification like an alter table statement we would get that wait on the other hand, if we did an alter table we would get Sch-m lock and we would have to wait for it common cases where it happens:- in the switch between partitions or at the end of an online index rebuild
- in an offline index rebuild
- schema modifications where other people are querying the same table
- in select statements when we use NOLOCK, RCSI, OR SI
LCK_M_I waits
this happens in Intent locks like IS. common causes:- Sch-m locks on the table, database etc.
- or where is a full lock on a PAGE or an OBJECT like an index or a table like some body reading a lot of rows and he escalates to S lock on the PAGE then another query tries to modify a row with an X lock and he tries to acquire IX on the PAGE, he will get blocked
- somebody using a TABLOCK hint
Expert SQL Server Transactions and Locking: Concurrency Internals for SQL Server Practitioners by Dmitri Korotkevitch Pro SQL Server Internals by Dmitri Korotkevitch SQL Server Advanced Troubleshooting and Performance Tuning: Best Practices and Technique by Dmitri Korotkevitch SQL Server Concurrency by Kalen Delaney Microsoft SQL Server 2012 Internals by Kalen Delaney
[…] already explained them in another blog, the same methods used there, are used here, since blocking is a query performance […]
[…] now this is a fairly generic code and we explained it in troubleshooting blocking and deadlocks, for more information you can go there. […]
[…] and we did all of that in our blog on troubleshooting blocking and deadlocks. […]