unless we were using DMVs in real-time or while the plans are cached, it is hard to detect the blocking and the blocked queries, today we are going to use extended events and persist them in an event_file so we could review them after the fact.
 and there are these things called packages which are a default combination of any of these components that could make up an event session, it comes with SQL server or you could customize your own
 now right click on sessions and click on the new session
 now here we will be in the general tab here we have the options if we need to start in every server start, set it on
then we have track causality option in extended events session to correlate across events turn it on
the option to start it immediately we want to do that too
and we have watch live data option we want that too
and the session name in our case ( could be anything) blocked_process_report
 then press on the events tab
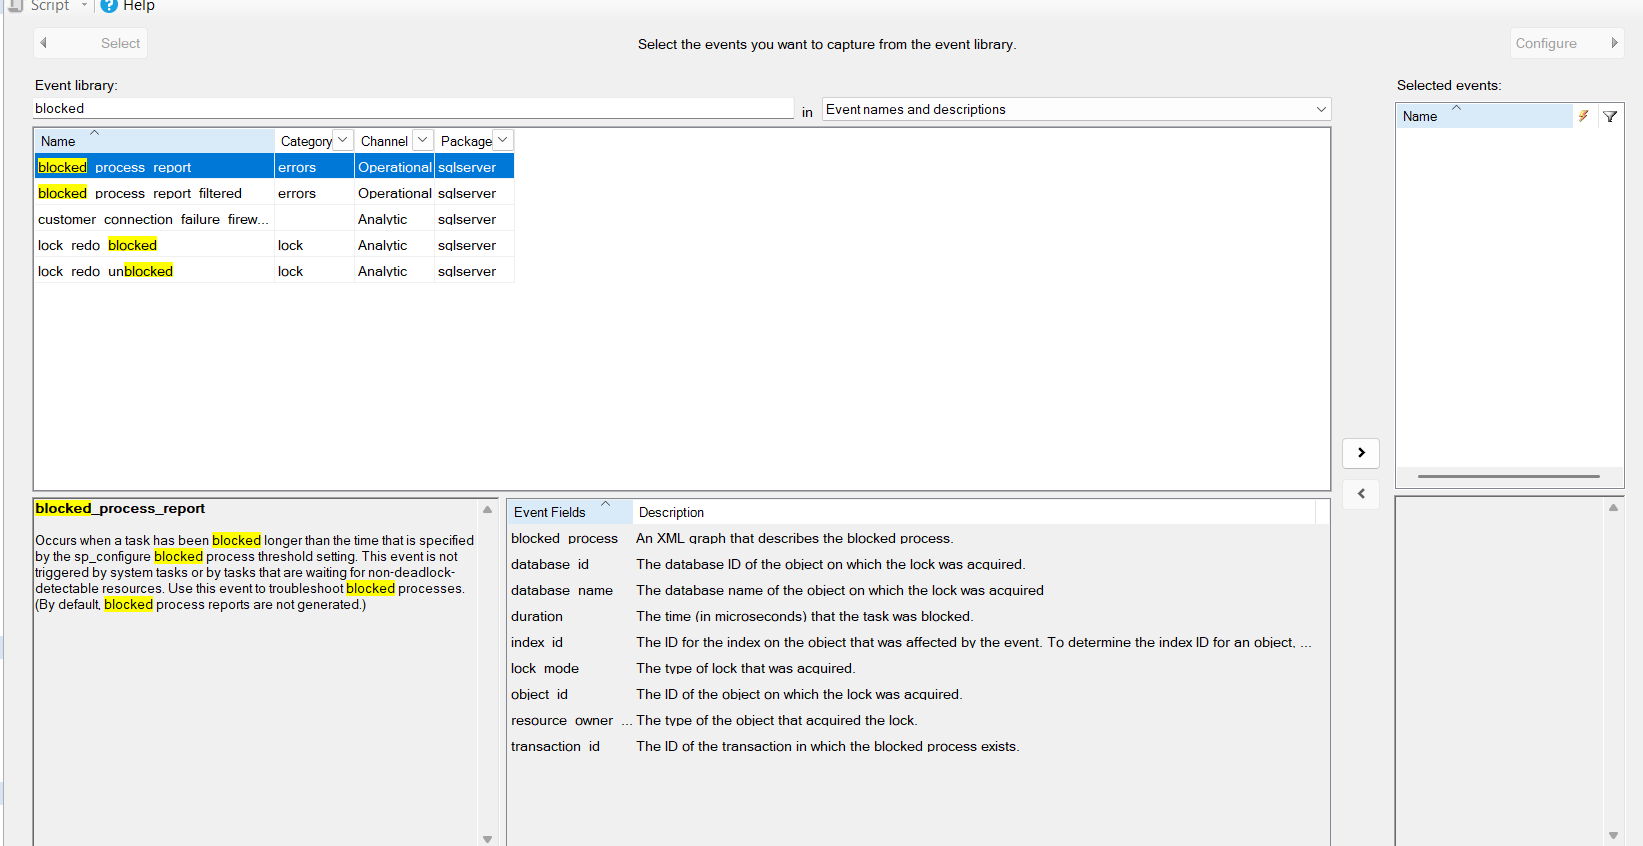
then you find a search field above event names type blocked the click on blocked_process_report
then click on configure
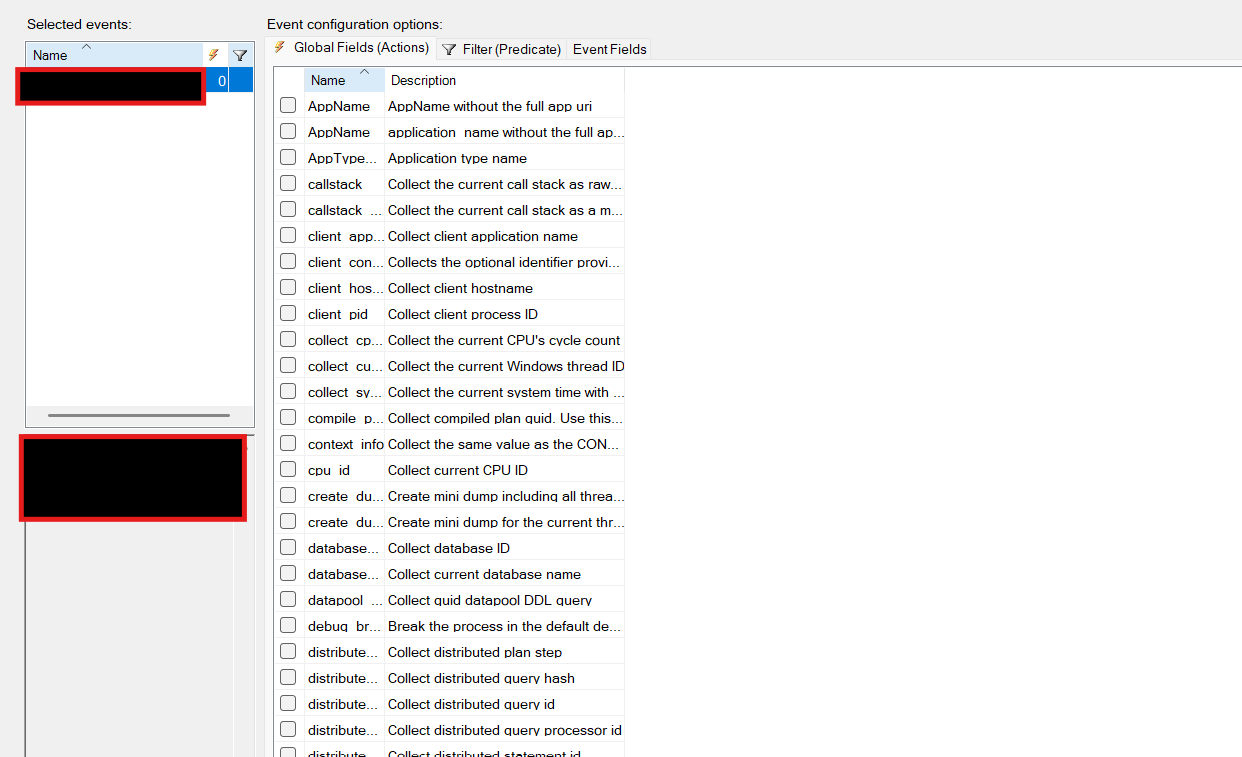
 here you will find the actions, the data you want to collect on event for example tsql stack we are going to check it for now
 then click on the event fields = predicates which like we said before filters to see if the event worth capturing for us
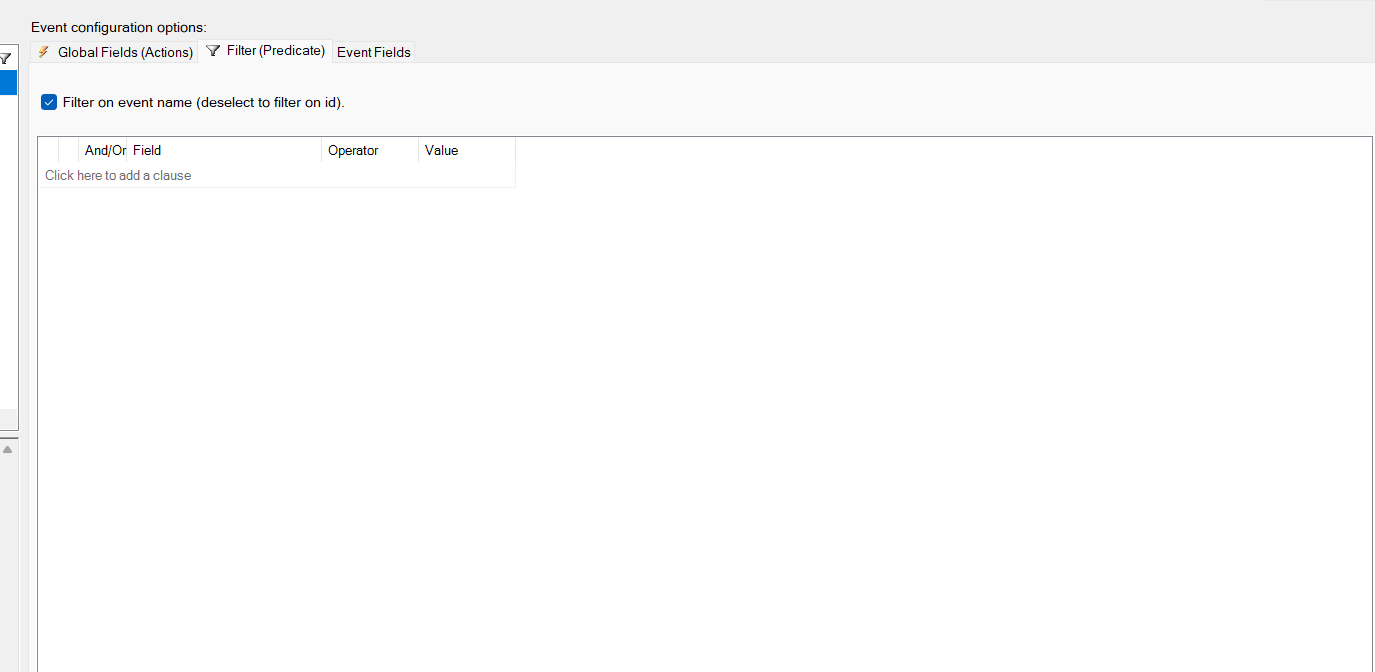 here we have four columns:
 if the session id is not 46 and is not 45 you should capture the event
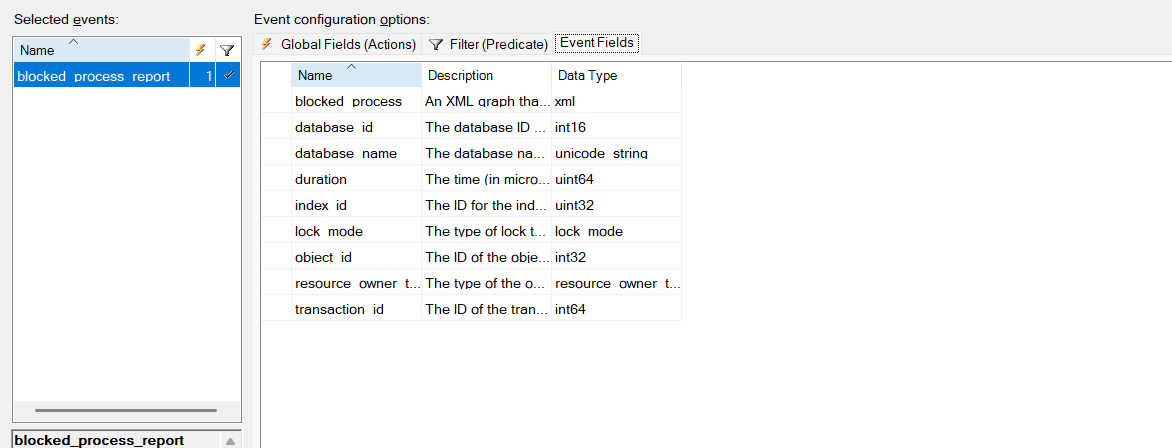
then click on event field, here you can add events or just see what does the event capture with details about each
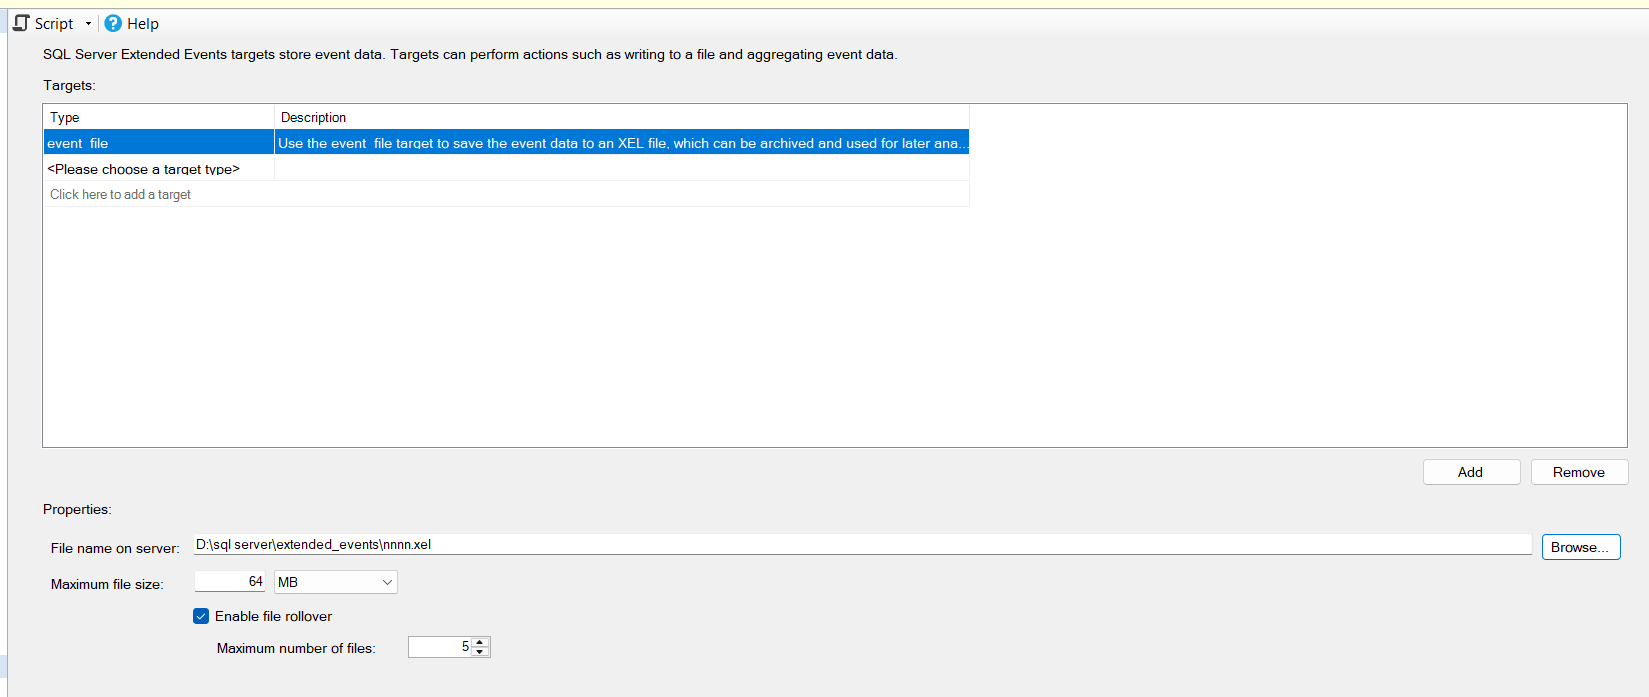
 now click on data storage which shows you the targets= the way you want your session to be stored
click on it then click event_file then make in MB
make 64
enable rollover so it could create a new file after the last one is full
then specify the path you want and name the file
then make 5 like the default
 then click on advanced
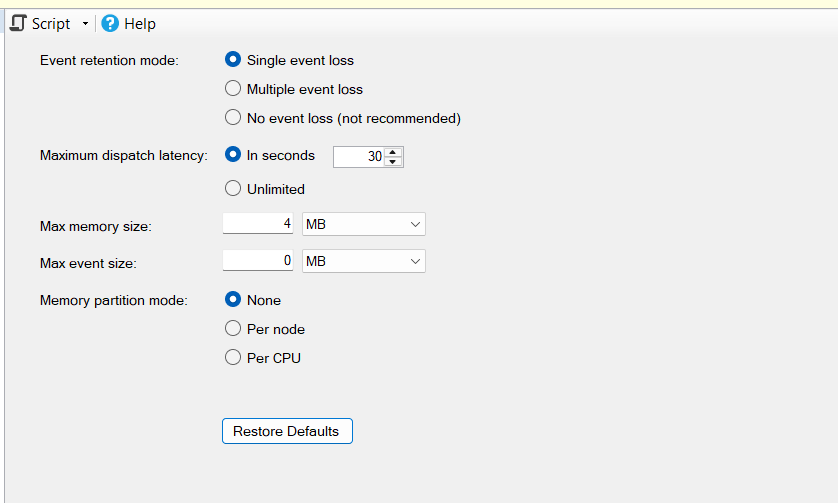
here we see options like event retention strategy:
 now click on script and it will pop up in a new window
 or you could just view the data from the event_file after the fact
then
first we will update but never commit
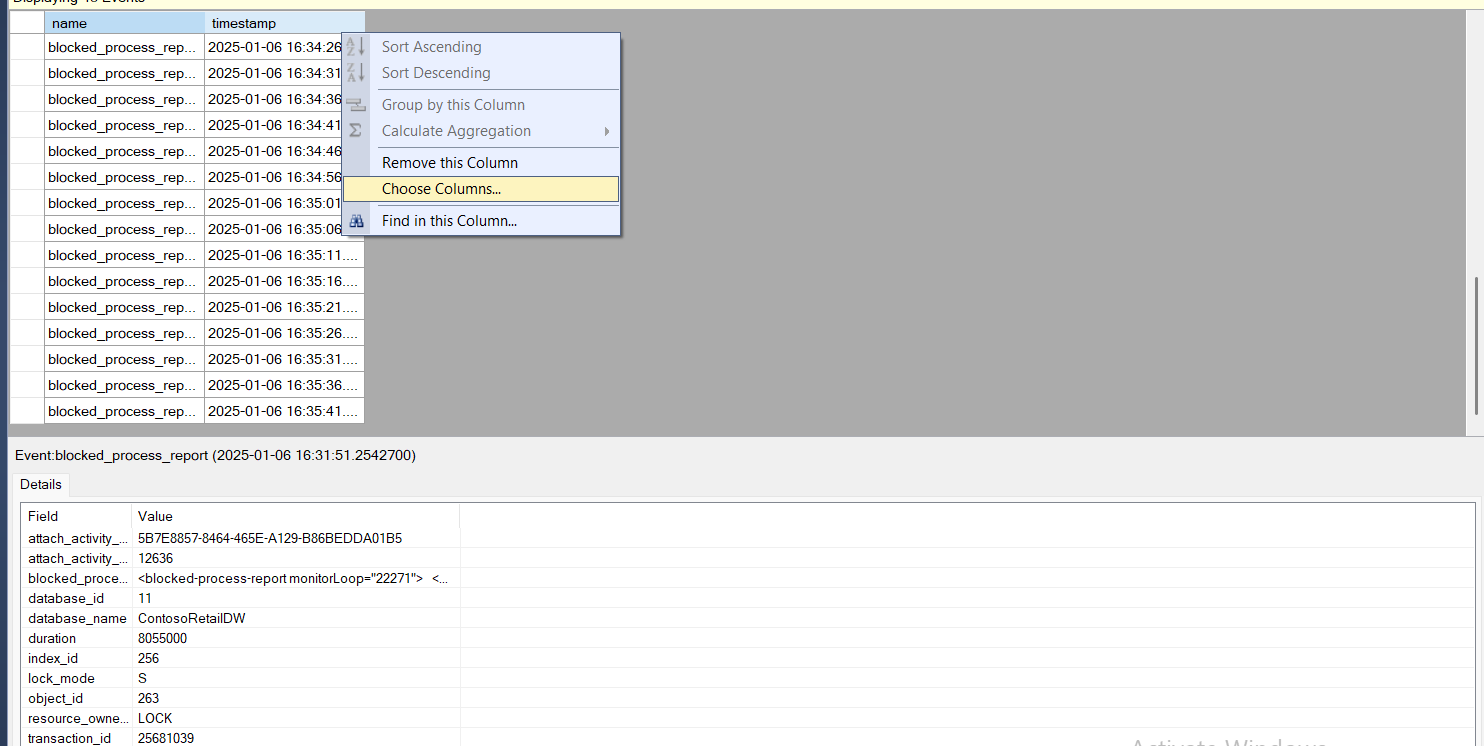 this would pop up
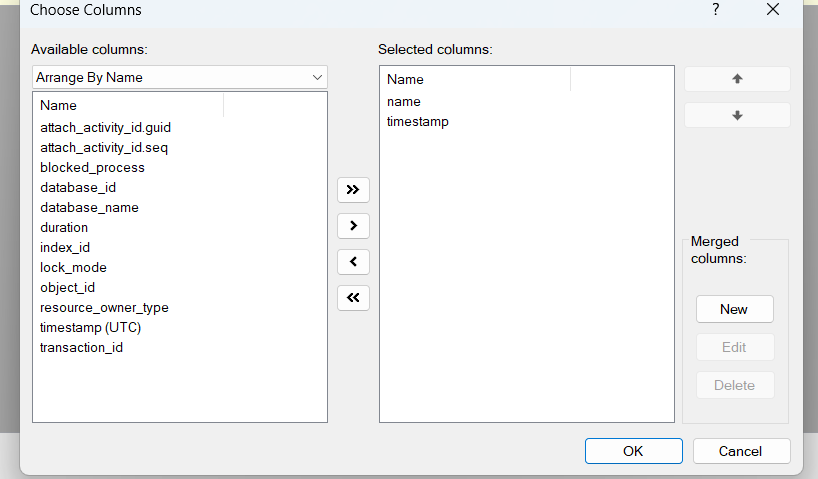 here you could add any columns you want to see these columns were recorded by the event itself if we had actions we could have seen them too
we could add any columns here and it would show up in our data presentation
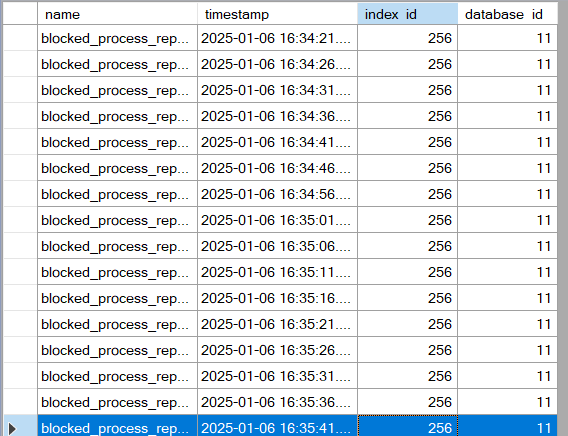 right click on any of the columns then in the bottom click on blocked_process field(in this case event field)
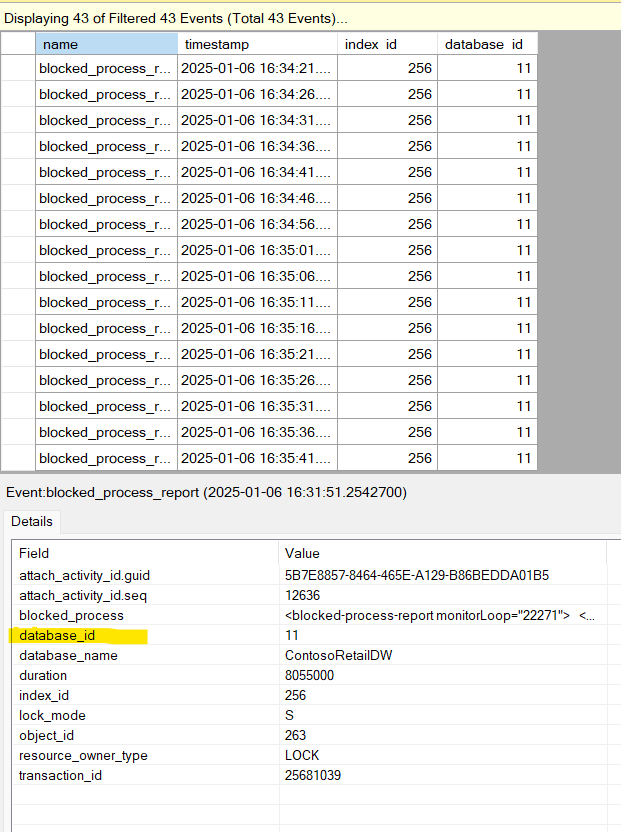 and the XML file would show up
let’s break it down one by one:
 after that
 now here we can see each transaction that’s blocking the other, and here we can notice chain blocking, since our first statement the update blocked the selects, in our previous demos using sqlquerystress each session blocked the previous one
 this is the output it is way easier to read than the XML
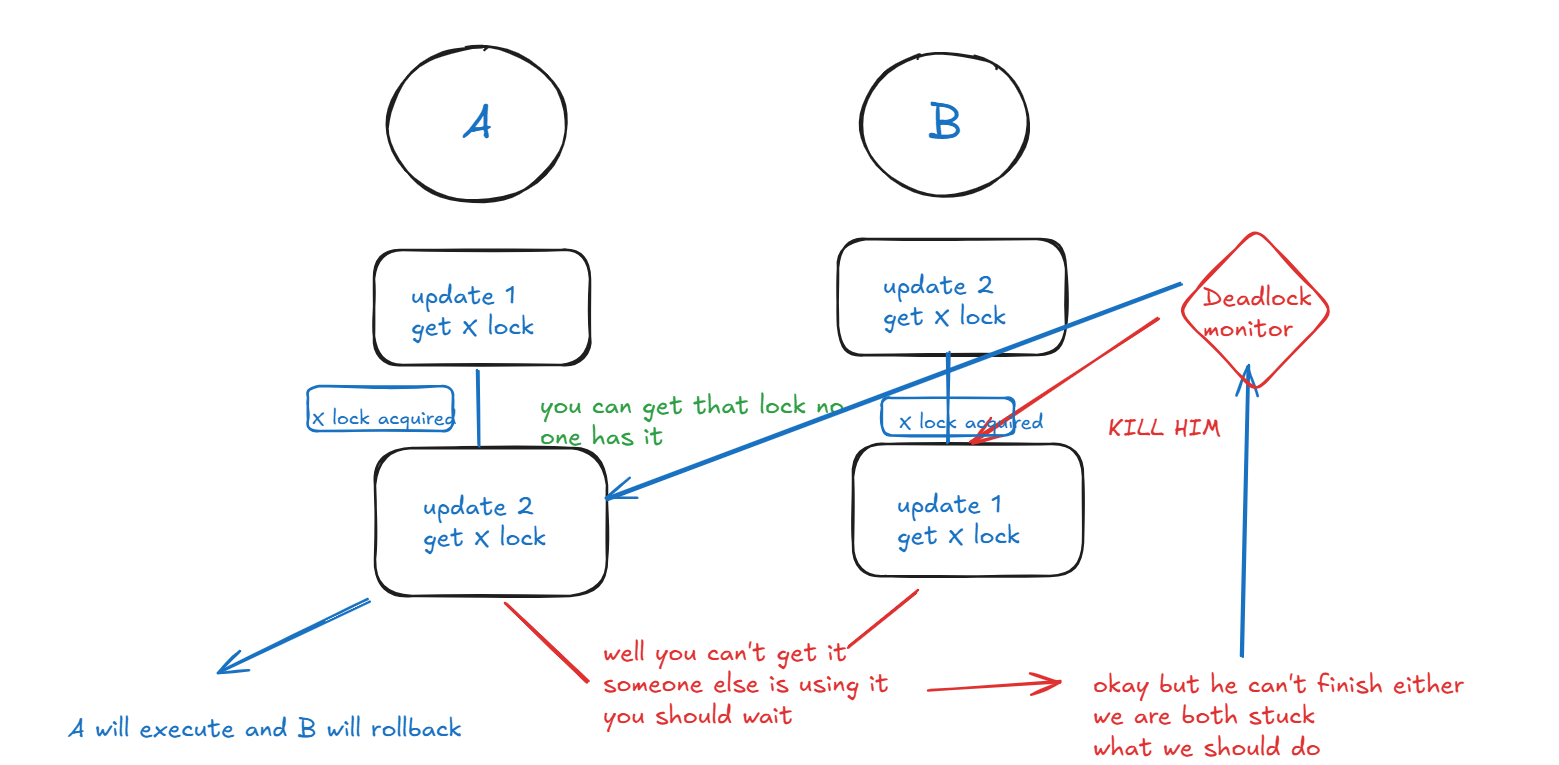 now let’s create a scenario on our table
we will update with ID 1 in the first session
then in another session, we will update id2
then in the first, we will update ID 2 and we will get blocked
then in the second will update ID 1 and will get blocked for a second then the deadlock monitor will kill one of the sessions and the other one will execute
 Now check our extended event session
 now we have the report itself and 4 other columns:
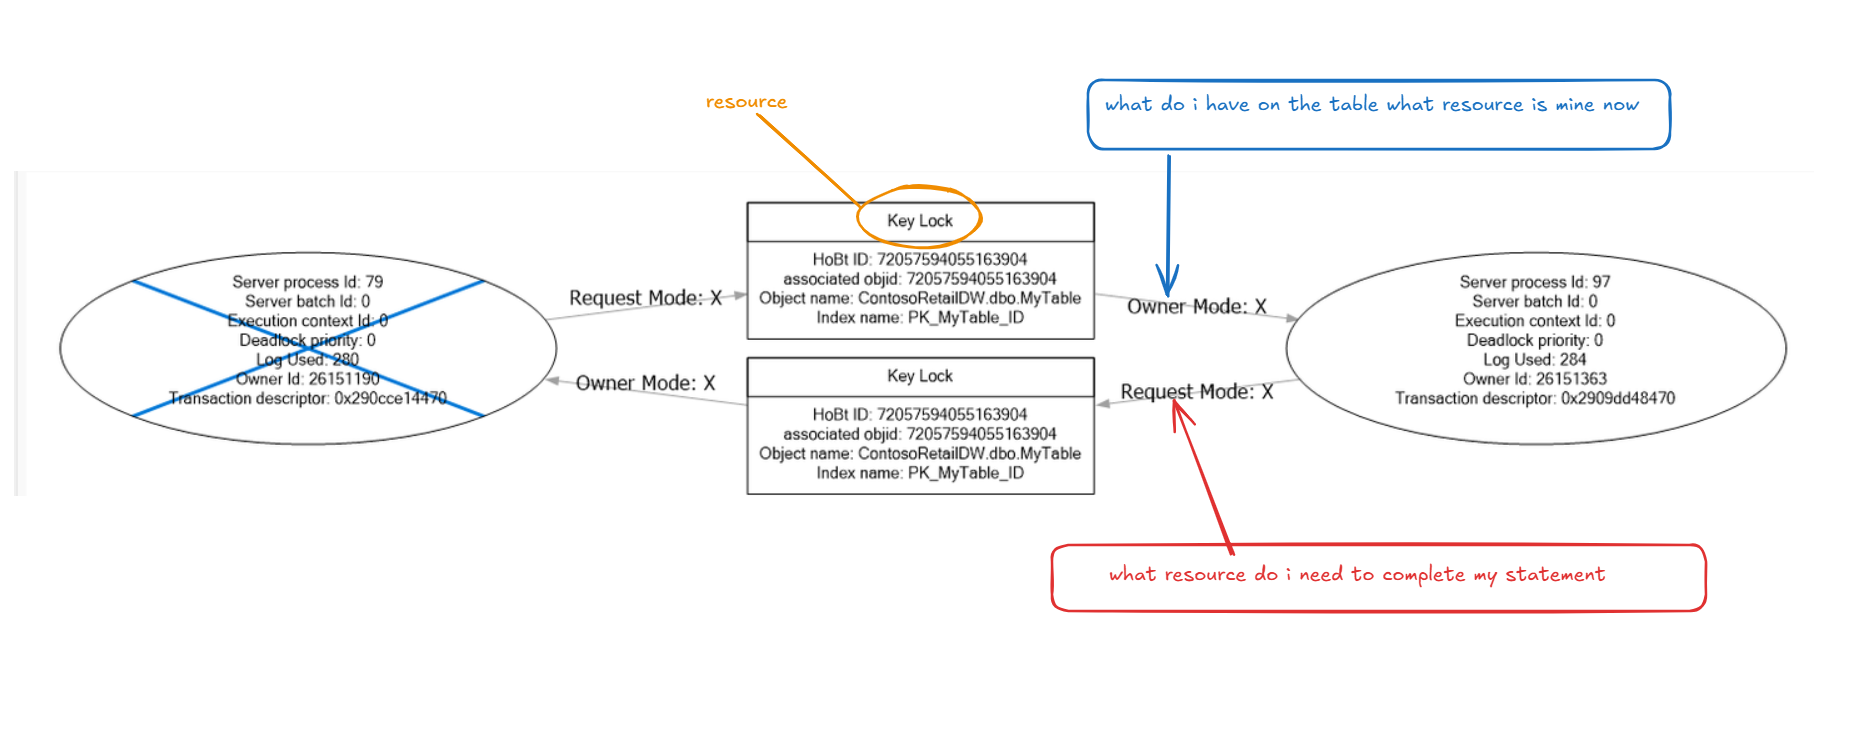 so it has two resources that the competition is on they are both keys in this case= index key
the owner mode: shows which one is the owner and what is the lock_mode = lock type that he is holding it is an X lock
the Request Mode : shows what he is waiting on, what he wants but he is blocked from getting here he wants An X lock but he can’t get it since the other transaction is holding a lock on it
here you can see that we had in MyTable, in the Clustered index we had a resource contention between two transactions each had an X lock on a row that the other one needed which had to be resolved otherwise both will be blocked, SQL Server’s deadlock monitor picked one with less logused and rolled it back and killed the session.
by following the server process ID we can find which one is the first to start
 then in double quotes name the graph and add the .xdl extention
then in Sentry Plan explorer
click on open It looks like a folder at the top
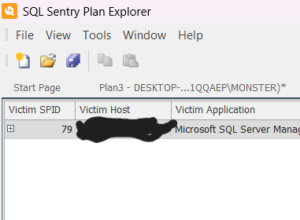 then click on your file
and you will have different layouts for the same graph we saw in SSMS and you can run it in order and see which one started first
for example
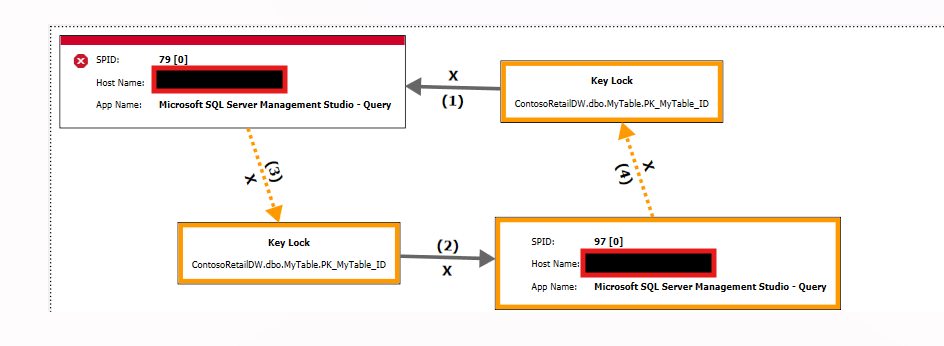 so first a key lock was granted to 79
after that, a key lock was granted to 97
then 79 tried to acquire a lock on the same resource that 97 held
then 97 tried to do the same thing
deadlock monitor picked 79 since it uses less log_space and killed it
Expert SQL Server Transactions and Locking: Concurrency Internals for SQL Server Practitioners by Dmitri Korotkevitch Pro SQL Server Internals by Dmitri Korotkevitch SQL Server Advanced Troubleshooting and Performance Tuning: Best Practices and Technique by Dmitri Korotkevitch SQL Server Concurrency by Kalen Delaney Microsoft SQL Server 2012 Internals by Kalen Delaney
The set up for the demo
we are going to use a simple table that has ID column that increments from 1 and has two columns Col1 and Col2 VARCHAR(100) id is a primary key and has a clustered index on it, then we are going to insert 10 000 rows in itIF OBJECT_ID('dbo.MyTable', 'U') IS NOT NULL
DROP TABLE dbo.MyTable;
GO
CREATE TABLE dbo.MyTable (
ID INT IDENTITY(1,1) CONSTRAINT PK_MyTable_ID PRIMARY KEY,
Col1 VARCHAR(100),
Col2 VARCHAR(100),
);
GO
DECLARE @i INT = 1;
WHILE @i <= 10000
BEGIN
INSERT INTO dbo.MyTable (Col1, Col2)
VALUES (CONCAT('C1', @i), CONCAT('C2', @i));
SET @i = @i + 1;
END;
GO
Creating the Extended Event Session
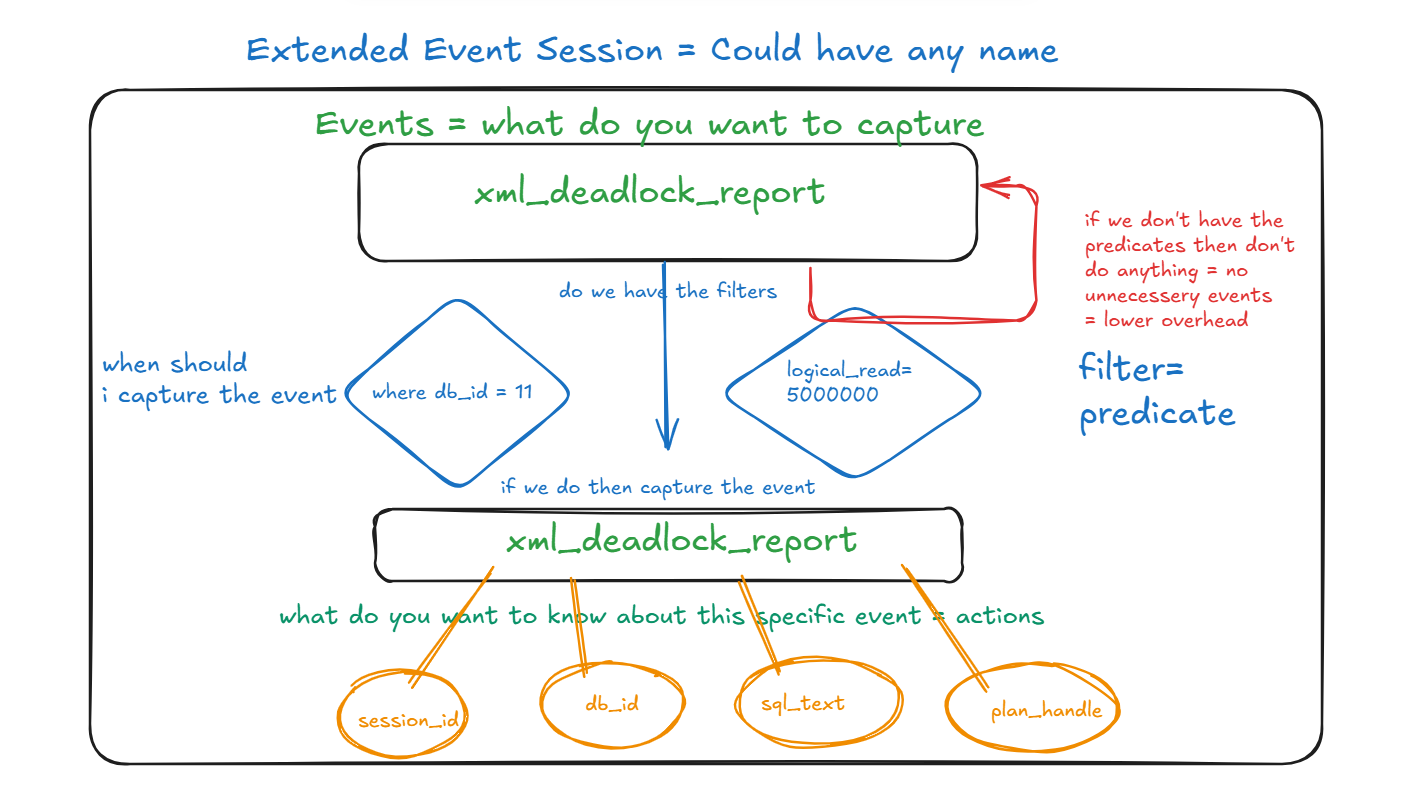
Extended events are lightweight ( relative to traces and if used cautiously) monitoring tools that provide data about SQL Server for troubleshooting. each extended event session has these components:- the session name itself: it contains certain events, their predicates, what actions should be taken when certain events get recorded, and how to keep the data in targets
- events: what you are trying to record is it a deadlock graph then every time a deadlock happens we record it
- predicates: when you are trying to record, when should I capture the event, how should I filter it, is it a specific lock in a particular database, is it the amount of logical reads is it both, or any of them could be fine, here you are trying to fine-tune the capture of an event to decrease the overhead unlike traces
- actions: so we captured an event what information do you want about it, do you want the db_id, db_name, session_id, user, client application, locks, blocking session, how many reads, and what do you want to record on the event that you requested
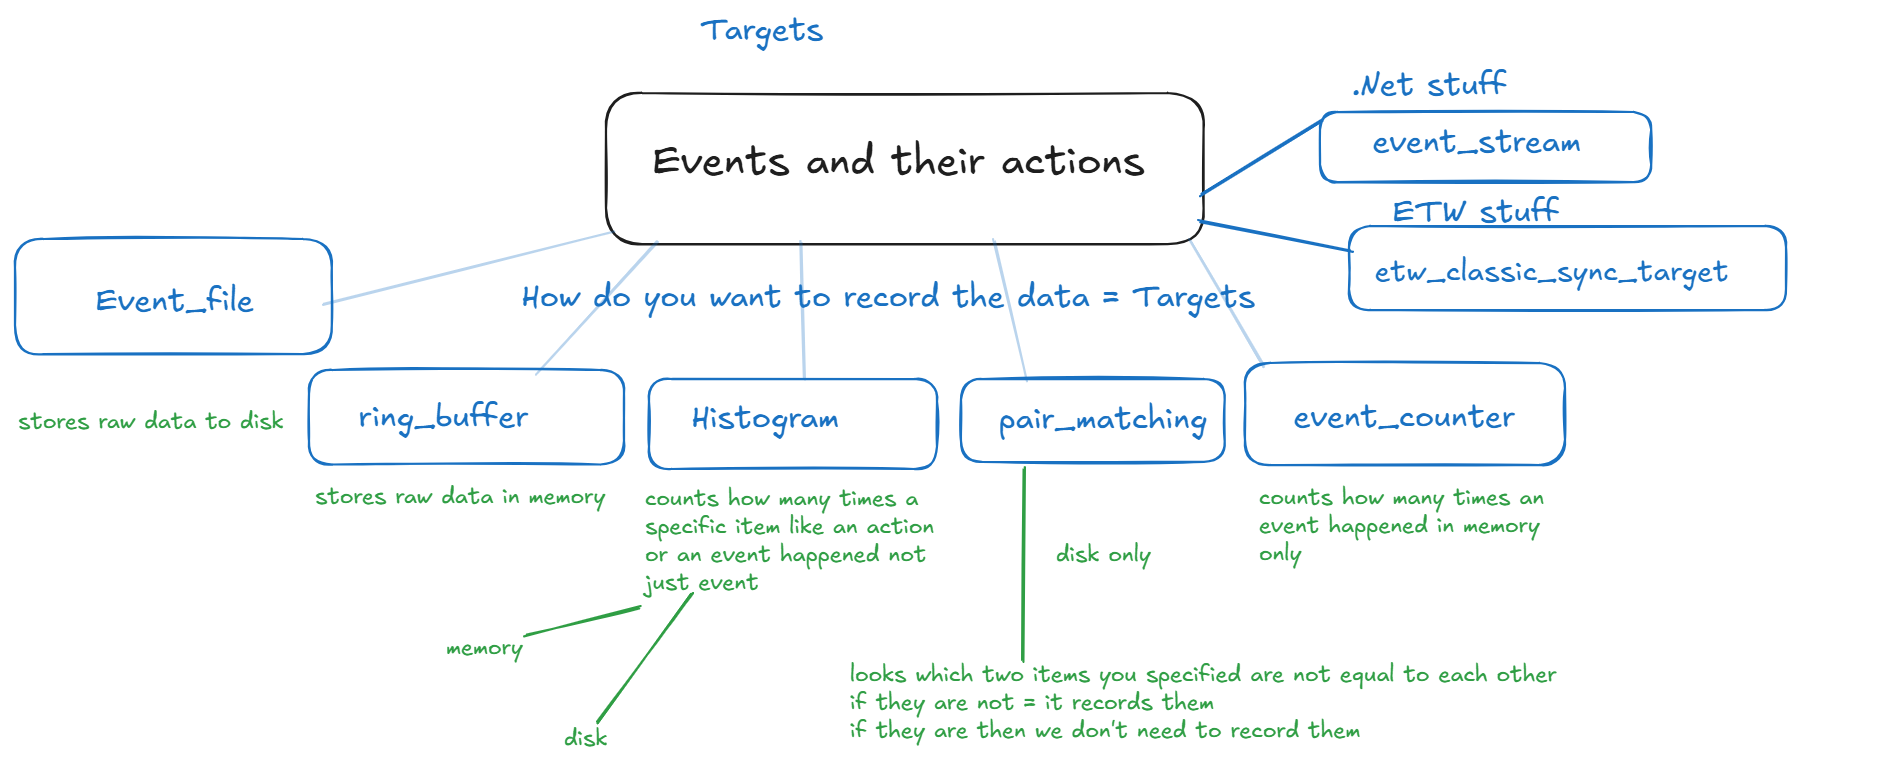
- Targets: how should I record the information, should I keep it in memory or should I write it to disk, should I aggregate it for you like providing the count of a specific lock on session_id, should I keep these aggregations in memory only or should I persist them in disk,

 and there are these things called packages which are a default combination of any of these components that could make up an event session, it comes with SQL server or you could customize your own
Capturing events for blocking = blocked process report
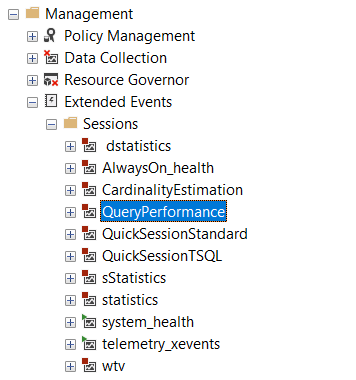
we are going to use the GUI first then after that we are going to print the script- so first in the object explorer click on management
- then click on extended events
- then click on sessions
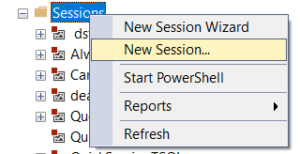
 now right click on sessions and click on the new session
 now here we will be in the general tab here we have the options if we need to start in every server start, set it on
then we have track causality option in extended events session to correlate across events turn it on
the option to start it immediately we want to do that too
and we have watch live data option we want that too
and the session name in our case ( could be anything) blocked_process_report
 then press on the events tab
then you find a search field above event names type blocked the click on blocked_process_report
then click on configure
 here you will find the actions, the data you want to collect on event for example tsql stack we are going to check it for now
 then click on the event fields = predicates which like we said before filters to see if the event worth capturing for us
 here we have four columns:
- the first one is AND/OR which says that if you have filter like database_id and session_id if you put the ADD clause both have to existent to capture the event, but in the OR clause either one could suffice
- the field contains the predicate itself like database_id
- operator could be = <> or any other one
- value is what the operator should be using like 11 for database_id
 if the session id is not 46 and is not 45 you should capture the event
then click on event field, here you can add events or just see what does the event capture with details about each
 now click on data storage which shows you the targets= the way you want your session to be stored
click on it then click event_file then make in MB
make 64
enable rollover so it could create a new file after the last one is full
then specify the path you want and name the file
then make 5 like the default
 then click on advanced
here we see options like event retention strategy:
- single event loss means once the memory dedicated is full it is going to drop the last single event
- in multiple it is going to drop the whole thing at once when it is full and start all over in live data unlike event_file which will never be dropped unless you specify it
- no event loss means once it is full it is going to stop recording and we will never catch the blocking process
 now click on script and it will pop up in a new window
CREATE EVENT SESSION [blocked_process_report] ON SERVER
ADD EVENT sqlserver.blocked_process_report(
--  for now we don't need this action
--ACTION(sqlserver.tsql_stack)
--for now we don't need those prediactes
--WHERE (([sqlserver].[session_id]<>(46)) AND ([sqlserver].[session_id]<>(45)))
)
ADD TARGET package0.event_file(
-- add  whatever path you want or you could specify it from the gu
SET filename=N'D:your file path',
max_file_size=(64))
WITH (MAX_MEMORY=4096 KB,
EVENT_RETENTION_MODE=ALLOW_SINGLE_EVENT_LOSS,
MAX_DISPATCH_LATENCY=30 SECONDS,
MAX_EVENT_SIZE=0 KB,
MEMORY_PARTITION_MODE=NONE,
TRACK_CAUSALITY=ON,
STARTUP_STATE=ON)
GO
- as you can see in Create you see the event session’s name
- then what kind of event do you want to add
- then you start specifying actions
- then in the where clause the predicates
- then after you are done with those you can add the type of targets you want
- then you specify the options in the with clause
Capturing events for deadlocks = deadlock_report
we are going to do the same steps for xml_deadlock_report- the name would be deadlock_report
- the event xml_deadlock_report
- the other steps are similar
CREATE EVENT SESSION [deadlock_report] ON SERVER
ADD EVENT sqlserver.xml_deadlock_report
-- your file path should be here
ADD TARGET package0.event_file(
SET filename=N'your file path',
max_file_size=(64))
WITH (MAX_MEMORY=4096 KB,
EVENT_RETENTION_MODE=ALLOW_SINGLE_EVENT_LOSS,
MAX_DISPATCH_LATENCY=30 SECONDS,
MAX_EVENT_SIZE=0 KB,
MEMORY_PARTITION_MODE=NONE,
TRACK_CAUSALITY=ON,
STARTUP_STATE=ON)
GO
Demos
Blocking
now let’s create a blocking scenario: before the blocking In Object Explorer right click on blocked_process_report, then click on watch live data or you could just view the data from the event_file after the fact
then
first we will update but never commit
go
BEGIN TRAN
UPDATE MyTable
SET Col1 = 'C11NEW'
WHERE ID = 1
--- NEVER COMMIT TRAN
go
BEGIN TRAN
SELECT Col1
FROM MyTable
WHERE ID BETWEEN 1 AND 10
COMMIT TRAN
go 10
 this would pop up
 here you could add any columns you want to see these columns were recorded by the event itself if we had actions we could have seen them too
we could add any columns here and it would show up in our data presentation
 right click on any of the columns then in the bottom click on blocked_process field(in this case event field)
 and the XML file would show up
let’s break it down one by one:
<blocked-process-report monitorLoop="22271">
 <blocked-process>
 ......
  <blocked-process>
<process id="process2908941aca8"
....
waitresource="KEY: 11:72057594055163904 (8194443284a0)" ......
lockMode="S" ......
status="suspended"
spid="155"  .....
....trancount="1" .....
clientapp="Microsoft SQL Server Management Studio - Query"
...... isolationlevel="read committed (2)"
xactid="25681039"
currentdb="11" currentdbname="ContosoRetailDW"
lockTimeout="4294967295" .....
- now we omitted a lot of the output and kept most of the relevant information
- waitresource="KEY: 11:72057594055163904 (8194443284a0)" ...... here it shows what kind of resource it is waiting on like an object or database or key or rid from sys.dm_tran_locks also we can use DBCC PAGE to read this
- status: suspended= waiting= what makes wait stats afterward it included information related to sys.dm_os_waiting_tasks
- server process id =spid= session_id
- trancount=1 meaning only one begin tran and commit tran, meaning not a nested transaction
- client app
- xactid= transaction_id = maybe relevant in optimized locking
- isolation_level=read committed
- the database name and id
- default lock_timeout
 <stackFrames>
      <frame id="00" ................
      </stackFrames>
<executionStack>
    <frame line="2" stmtstart="46" stmtend="156" sqlhandle="0x020000005dd65d145d7936f60feeb801452190ae188110420000000000000000000000000000000000000000" />
    <frame line="2" stmtstart="26" stmtend="130" sqlhandle="0x02000000d63ed42a302c07953d1a409b460ac74e6efb33e70000000000000000000000000000000000000000" />
   </executionStack>
-- Declare variables for the SQL handle and offsets
DECLARE @sql_handle VARBINARY(64) = 0x020000005dd65d145d7936f60feeb801452190ae188110420000000000000000000000000000000000000000;
DECLARE @stmtstart INT = 46;
DECLARE @stmtend INT = 156;

-- Retrieve the specific query text for the SQL handle
SELECT
    SUBSTRING(qtext.text, (@stmtstart / 2) + 1,
        ((CASE @stmtend
            WHEN -1 THEN DATALENGTH(qtext.text)
            ELSE @stmtend
         END - @stmtstart) / 2) + 1) AS QueryText
FROM
    sys.dm_exec_sql_text(@sql_handle) AS qtext;
 after that
<inputbuf>
BEGIN TRAN
SELECT Col1
FROM MyTable
WHERE ID BETWEEN 1 AND 10
COMMIT TRAN
   </inputbuf>
</process>
 </blocked-process>
<blocking-process>
  <process status="sleeping"
  spid="51" ....
  priority="0" trancount="1" ....
  clientapp="Microsoft SQL Server Management Studio - Query"
  .... isolationlevel="read committed (2)"
  ... currentdb="11" currentdbname="ContosoRetailDW" lockTimeout="4294967295"
  ........
		   <executionStack />
   <inputbuf>
BEGIN TRAN
UPDATE MyTable
SET Col1 = 'C11NEW'
WHERE ID = 1
--- NEVER COMMIT TRAN
   </inputbuf>
  </process>
 </blocking-process>
</blocked-process-report>
Parsing the XML file using Erik Darling’s sp_HumanEventsBlockViewer
as you can see reading the XML file could be really daunting, this stored procedure facilitates that by converting it to a more readable format this is the link(HERE) you just download the SQL file install it in a separate database then run and it will be installed after that exec the procedureEXEC dbo.sp_HumanEventsBlockViewer @session_name = N'blocked_process_report';
 now here we can see each transaction that’s blocking the other, and here we can notice chain blocking, since our first statement the update blocked the selects, in our previous demos using sqlquerystress each session blocked the previous one
 this is the output it is way easier to read than the XML
Deadlocking
deadlocking happens when two queries hold locks that the other one needs. we already went over it in another blog(HERE) and this is a graphical presentation now let’s create a scenario on our table
we will update with ID 1 in the first session
then in another session, we will update id2
then in the first, we will update ID 2 and we will get blocked
then in the second will update ID 1 and will get blocked for a second then the deadlock monitor will kill one of the sessions and the other one will execute
BEGIN TRAN
UPDATE MyTable
SET COL1='SOME_VALUE'
WHERE ID= 1
--- don't commit
BEGIN TRAN
UPDATE MyTable
SET Col1='2NEW_VALUE'
WHERE ID = 2
-- don't commit
BEGIN TRAN
UPDATE MyTable
SET Col1='SOME_VALUE'
WHERE ID = 2
--- you can commit or rollback
ROLLBACK
BEGIN TRAN
UPDATE MyTable
SET Col1='2NEW_VALUE'
WHERE ID = 1
-- you can commit or rollback
ROLLBACK
 Now check our extended event session
 now we have the report itself and 4 other columns:
- attach_activity_id.guid = guid is a server unique value that identifies the activity in session or the transaction to track it = what is the id for this specific deadlock
- attach_activity_id.seq = where as in order of the specific transaction did this happen here it is the deadlock is the activity and it was the first
- attach_activity_id_xfer.guid = guid for the activity(deadlock) across the threads(WORKERS) in SQL server did this happen
- attach_activity_id.xfer.seq = where was it in the order the first the last to get executed across workers here it was 12680
Deadlock graph in SSMS
 so it has two resources that the competition is on they are both keys in this case= index key
the owner mode: shows which one is the owner and what is the lock_mode = lock type that he is holding it is an X lock
the Request Mode : shows what he is waiting on, what he wants but he is blocked from getting here he wants An X lock but he can’t get it since the other transaction is holding a lock on it
here you can see that we had in MyTable, in the Clustered index we had a resource contention between two transactions each had an X lock on a row that the other one needed which had to be resolved otherwise both will be blocked, SQL Server’s deadlock monitor picked one with less logused and rolled it back and killed the session.
by following the server process ID we can find which one is the first to start
Deadlock graph in Sentry Plan Explorer
here it provides a form that is easier to interpret the graph you could choose between them if you like first, you need to click on the details tab in the event then click on the XML report right click on the top of the XML report then in double quotes name the graph and add the .xdl extention
then in Sentry Plan explorer
click on open It looks like a folder at the top
 then click on your file
and you will have different layouts for the same graph we saw in SSMS and you can run it in order and see which one started first
for example
 so first a key lock was granted to 79
after that, a key lock was granted to 97
then 79 tried to acquire a lock on the same resource that 97 held
then 97 tried to do the same thing
deadlock monitor picked 79 since it uses less log_space and killed it
The XML report itself
let’s get it<deadlock>
 <victim-list>
  <victimProcess id="process290899c5c28" />
 </victim-list>
 <process-list>
 <process_list>
<process id="process290899c5c28"
taskpriority="0"
logused="280"
waitresource="KEY: 11:72057594055163904 (61a06abd401c)"
waittime="19542"
ownerId="26151190"
...
..XDES="0x290cce14470"
lockMode="X"
schedulerid="15"
kpid="10700"
 status="suspended"
 spid="79"
 sbid="0" ecid="0" priority="0"
 trancount="3"
 ..... clientapp="Microsoft SQL Server Management Studio - Query" hostname="" ...
  loginname=".."
  isolationlevel="read committed (2)"
  xactid="26151190"
  currentdb="11"
  currentdbname="ContosoRetailDW"
  lockTimeout="4294967295" ....>
   <stackFrames>
      </stackFrames>
<executionStack>
    <frame procname="adhoc" line="2" stmtstart="58" stmtend="150" sqlhandle="0x02000000bd3d8e19bab4e51ea83501a263de67ba51d6f49a0000000000000000000000000000000000000000">
unknown    </frame>
    <frame procname="adhoc" line="2" stmtstart="26" stmtend="128" sqlhandle="0x02000000befda829841dee8cfbb46fceeb762c6262b552b40000000000000000000000000000000000000000">
unknown    </frame>
   </executionStack>
<inputbuf>
BEGIN TRAN
UPDATE MyTable
SET Col1='SOME_VALUE'
WHERE ID = 2
--- you can commit or rollback
ROLLBACK   </inputbuf>
</process>

  </process>
   </process-list>
 <resource-list>

 </resource-list>
 <resource-list>
  <keylock
  hobtid="72057594055163904"
  dbid="11"
  objectname="ContosoRetailDW.dbo.MyTable"
  indexname="PK_MyTable_ID"
  id="lock290d0b7d280"
  mode="X"
  associatedObjectId="72057594055163904">
   <owner-list>
    <owner id="process290abba3088" mode="X" />
   </owner-list>
   <waiter-list>
    <waiter id="process290899c5c28" mode="X" requestType="wait" />
   </waiter-list>
  </keylock>
Expert SQL Server Transactions and Locking: Concurrency Internals for SQL Server Practitioners by Dmitri Korotkevitch Pro SQL Server Internals by Dmitri Korotkevitch SQL Server Advanced Troubleshooting and Performance Tuning: Best Practices and Technique by Dmitri Korotkevitch SQL Server Concurrency by Kalen Delaney Microsoft SQL Server 2012 Internals by Kalen Delaney
[…] we already introduced it here […]